In probability theory, a normaldistribution is a type of continuous probability distribution for a real-valued random variable. The general form of its probability density function is

In statistics, the standard deviation is a measure of the amount of variation or dispersion of a set of values. A low standard deviation indicates that the values tend to be close to the mean of the set, while a high standard deviation indicates that the values are spread out over a wider range.
The weighted arithmetic mean is similar to an ordinary arithmetic mean, except that instead of each of the data points contributing equally to the final average, some data points contribute more than others. The notion of weighted mean plays a role in descriptive statistics and also occurs in a more general form in several other areas of mathematics.

In probability and statistics, Student's t-distribution is any member of a family of continuous probability distributions that arise when estimating the mean of a normally-distributed population in situations where the sample size is small and the population's standard deviation is unknown. It was developed by English statistician William Sealy Gosset under the pseudonym "Student".

A Z-test is any statistical test for which the distribution of the test statistic under the null hypothesis can be approximated by a normal distribution. Z-test tests the mean of a distribution. For each significance level in the confidence interval, the Z-test has a single critical value which makes it more convenient than the Student's t-test whose critical values are defined by the sample size.
In statistics, an effect size is a number measuring the strength of the relationship between two variables in a statistical population, or a sample-based estimate of that quantity. It can refer to the value of a statistic calculated from a sample of data, the value of a parameter of a hypothetical statistical population, or to the equation that operationalizes how statistics or parameters lead to the effect size value. Examples of effect sizes include the correlation between two variables, the regression coefficient in a regression, the mean difference, or the risk of a particular event happening. Effect sizes complement statistical hypothesis testing, and play an important role in power analyses, sample size planning, and in meta-analyses. The cluster of data-analysis methods concerning effect sizes is referred to as estimation statistics.
In statistical inference, specifically predictive inference, a prediction interval is an estimate of an interval in which a future observation will fall, with a certain probability, given what has already been observed. Prediction intervals are often used in regression analysis.
A tolerance interval is a statistical interval within which, with some confidence level, a specified proportion of a sampled population falls. "More specifically, a 100×p%/100×(1−α) tolerance interval provides limits within which at least a certain proportion (p) of the population falls with a given level of confidence (1−α)." "A tolerance interval (TI) based on a sample is constructed so that it would include at least a proportion p of the sampled population with confidence 1−α; such a TI is usually referred to as p-content − (1−α) coverage TI." "A upper tolerance limit (TL) is simply a 1−α upper confidence limit for the 100 p percentile of the population."
In probability theory and statistics, the coefficient of variation (CV), also known as relative standard deviation (RSD), is a standardized measure of dispersion of a probability distribution or frequency distribution. It is often expressed as a percentage, and is defined as the ratio of the standard deviation to the mean . The CV or RSD is widely used in analytical chemistry to express the precision and repeatability of an assay. It is also commonly used in fields such as engineering or physics when doing quality assurance studies and ANOVA gauge R&R. In addition, CV is utilized by economists and investors in economic models.
The mode is the value that appears most often in a set of data values. If X is a discrete random variable, the mode is the value x at which the probability mass function takes its maximum value. In other words, it is the value that is most likely to be sampled.
In Bayesian statistics, a maximum a posteriori probability (MAP) estimate is an estimate of an unknown quantity, that equals the mode of the posterior distribution. The MAP can be used to obtain a point estimate of an unobserved quantity on the basis of empirical data. It is closely related to the method of maximum likelihood (ML) estimation, but employs an augmented optimization objective which incorporates a prior distribution over the quantity one wants to estimate. MAP estimation can therefore be seen as a regularization of maximum likelihood estimation.

In statistical process monitoring (SPM), the and R chart is a type of scheme, popularly known as control chart, used to monitor the mean and range of a normally distributed variables simultaneously, when samples are collected at regular intervals from a business or industrial process. It is often used to monitor the variables data but the performance of the and R chart may suffer when the normality assumption is not valid. This is connected to traditional statistical quality control (SQC) and statistical process control (SPC). However, Woodall noted that "I believe that the use of control charts and other monitoring methods should be referred to as “statistical process monitoring,” not “statistical process control (SPC).”"
A process is a unique combination of tools, materials, methods, and people engaged in producing a measurable output; for example a manufacturing line for machine parts. All processes have inherent statistical variability which can be evaluated by statistical methods.
The Z-factor is a measure of statistical effect size. It has been proposed for use in high-throughput screening (where it is also known as Z-prime, and commonly written as Z' to judge whether the response in a particular assay is large enough to warrant further attention.
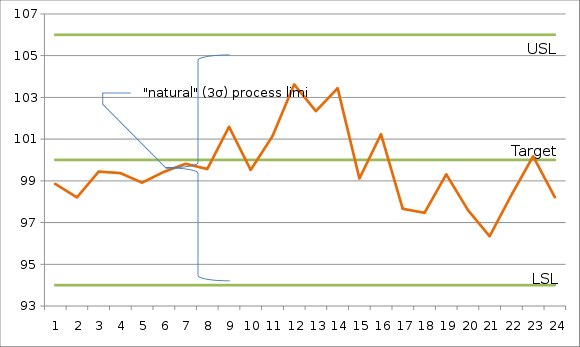
In process improvement efforts, the process capability index or process capability ratio is a statistical measure of process capability: the ability of a process to produce output within specification limits. The concept of process capability only holds meaning for processes that are in a state of statistical control. Process capability indices measure how much "natural variation" a process experiences relative to its specification limits and allows different processes to be compared with respect to how well an organization controls them.
In statistics, the bias of an estimator is the difference between this estimator's expected value and the true value of the parameter being estimated. An estimator or decision rule with zero bias is called unbiased. In statistics, "bias" is an objective property of an estimator. Bias can also be measured with respect to the median, rather than the mean, in which case one distinguishes median-unbiased from the usual mean-unbiasedness property. Bias is a distinct concept from consistency. Consistent estimators converge in probability to the true value of the parameter, but may be biased or unbiased; see bias versus consistency for more.

In statistics, the 68–95–99.7 rule, also known as the empirical rule, is a shorthand used to remember the percentage of values that lie within a band around the mean in a normal distribution with a width of two, four and six standard deviations, respectively; more precisely, 68.27%, 95.45% and 99.73% of the values lie within one, two and three standard deviations of the mean, respectively.
Experimental uncertainty analysis is a technique that analyses a derived quantity, based on the uncertainties in the experimentally measured quantities that are used in some form of mathematical relationship ("model") to calculate that derived quantity. The model used to convert the measurements into the derived quantity is usually based on fundamental principles of a science or engineering discipline.

In fabrication the yield is one of the most important measures. Also in the design phase engineers already try to maximize the yield by using simulation techniques and statistical models. Often the data follows the well-known bell-shaped normal distribution, and for such distributions there is a simple direct relationship between the design margin and the yield. If we express the specification margin in terms of standard deviation sigma, we can immediately calculate yield Y according to this specification. The concept of worst-case distance (WCD) extends this simple idea for applying it to more complex problems. The WCD is a metric originally applied in electronic design for yield optimization and design centering, nowadays also applied as a metric for quantifying electronic system and device robustness.
A variables sampling plan is an acceptance sampling technique. Plans for variables are intended for quality characteristics that are measured in a continuous scale. This plan requires the knowledge of the statistical model e.g. normal distribution. The historical evolution of this technique dates back to the seminal work of Wallis (1943). The purpose of a plan for variables is to assess whether the process is operating far enough from the specification limit. Plans for variables may produce a similar OC curve to attribute plans with significantly less sample size.