Related Research Articles

Weather forecasting is the application of science and technology to predict the conditions of the atmosphere for a given location and time. People have attempted to predict the weather informally for millennia and formally since the 19th century.

A tornado warning is a public warning that is issued by weather forecasting agencies to an area in the direct path of a tornado, or a thunderstorm capable of producing one, and advises individuals in that area to take cover. Modern weather surveillance technology such as Doppler weather radar can detect rotation in a thunderstorm, allowing for early warning before a tornado develops. They are also commonly issued based on reported visual sighting of a tornado, funnel cloud, or wall cloud, typically from weather spotters or the public, but also law enforcement or local emergency management. When radar is unavailable or insufficient, such ground truth is crucial. In particular, a tornado can develop in a gap of radar coverage, of which there are several known in the United States.

A tornado watch is a severe weather watch product of the National Weather Service that is issued by national weather forecasting agencies when meteorological conditions are favorable for the development of severe thunderstorms capable of producing tornadoes. In addition to the potential for tornado development, thunderstorms that develop within the watch area may contain large hail, straight-line winds, intense rainfall and/or flooding that pose a similar damage risk as the attendant tornado threat. A tornado watch does not mean a tornado is active or will appear, just that favorable conditions increases the likelihood of such happening. A watch must not be confused with a tornado warning.
The National Weather Service (NWS) is an agency of the United States federal government that is tasked with providing weather forecasts, warnings of hazardous weather, and other weather-related products to organizations and the public for the purposes of protection, safety, and general information. It is a part of the National Oceanic and Atmospheric Administration (NOAA) branch of the Department of Commerce, and is headquartered in Silver Spring, Maryland, within the Washington metropolitan area. The agency was known as the United States Weather Bureau from 1890 until it adopted its current name in 1970.
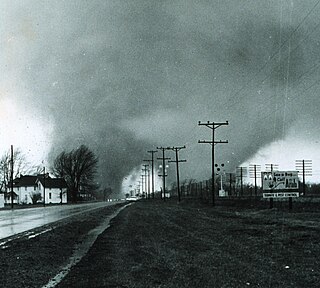
On April 10–12, 1965, a historic severe weather event affected the Midwestern and Southeastern United States. The tornado outbreak produced 55 confirmed tornadoes in one day and 16 hours. The worst part of the outbreak occurred during the afternoon hours of April 11 into the overnight hours going into April 12. The second-largest tornado outbreak on record at the time, this deadly series of tornadoes, which became known as the 1965 Palm Sunday tornado outbreak, inflicted a swath of destruction from Cedar County, Iowa, to Cuyahoga County, Ohio, and a swath 450 miles long (724 km) from Kent County, Michigan, to Montgomery County, Indiana. The main part of the outbreak lasted 16 hours and 35 minutes and is among the most intense outbreaks, in terms of tornado strength, ever recorded, including at least four "double/twin funnel" tornadoes. In all, the outbreak killed 266 people, injured 3,662 others, and caused $1.217 billion in damage. In 2023, tornado expert Thomas P. Grazulis created the Outbreak Intensity Score (OIS) as a way to rank various tornado outbreaks. The 1965 Palm Sunday tornado outbreak received an OIS of 238, making it the third worst tornado outbreak in recorded history.
A weather map, also known as synoptic weather chart, displays various meteorological features across a particular area at a particular point in time and has various symbols which all have specific meanings. Such maps have been in use since the mid-19th century and are used for research and weather forecasting purposes. Maps using isotherms show temperature gradients, which can help locate weather fronts. Isotach maps, analyzing lines of equal wind speed, on a constant pressure surface of 300 or 250 hPa show where the jet stream is located. Use of constant pressure charts at the 700 and 500 hPa level can indicate tropical cyclone motion. Two-dimensional streamlines based on wind speeds at various levels show areas of convergence and divergence in the wind field, which are helpful in determining the location of features within the wind pattern. A popular type of surface weather map is the surface weather analysis, which plots isobars to depict areas of high pressure and low pressure. Cloud codes are translated into symbols and plotted on these maps along with other meteorological data that are included in synoptic reports sent by professionally trained observers.

METAR is a format for reporting weather information. A METAR weather report is predominantly used by aircraft pilots, and by meteorologists, who use aggregated METAR information to assist in weather forecasting. Today, according to the advancement of technology in civil aviation, the METAR is sent as IWXXM model.
The Storm Prediction Center (SPC) is a US government agency that is part of the National Centers for Environmental Prediction (NCEP), operating under the control of the National Weather Service (NWS), which in turn is part of the National Oceanic and Atmospheric Administration (NOAA) of the United States Department of Commerce (DoC).
In meteorology and aviation, terminal aerodrome forecast (TAF) is a format for reporting weather forecast information, particularly as it relates to aviation. TAFs are issued at least four times a day, every six hours, for major civil airfields: 0000, 0600, 1200 and 1800 UTC, and generally apply to a 24- or 30-hour period, and an area within approximately five statute miles (8.0 km) from the center of an airport runway complex. TAFs are issued every three hours for military airfields and some civil airfields and cover a period ranging from 3 hours to 30 hours.
This article describes severe weather terminology used by the National Weather Service (NWS) in the United States. The NWS, a government agency operating as an arm of the National Oceanic and Atmospheric Administration (NOAA) branch.It defines precise meanings for nearly all of its weather terms.

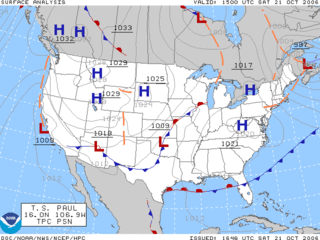
The Tornado outbreak sequence of March 9–13, 2006 was an early season and long lasting tornado outbreak sequence in the central United States that started on the morning of March 9 and continued for over four days until the evening of March 13. The outbreak produced 99 confirmed tornadoes, which killed a total of 10 people. The Storm Prediction Center (SPC) issued multiple elevated outlook throughout the sequence, including a rare high risk for March 12, which would end up being the most intense day of the outbreak, producing 62 in total. 11 F3 tornadoes were tallied, and a violent F4 tornado touched down in Monroe County, Missouri, becoming the strongest of the outbreak. Multiple tornado emergencies were issued for tornadoes throughout the outbreak as well. An intense F3 tornado that affected the towns of Renick and Maddison in Missouri killed 4 people and injured dozens others, becoming the deadliest of the sequence. Multiple of the tornadoes were long-tracked in nature, with 6 of them having paths exceeding 30 miles (48 km). One particular supercell thunderstorm during the outbreak persisted for many hours and progressed in excess of 800 miles (1,300 km) through Oklahoma, Kansas, Missouri, Illinois, Indiana, and extreme southern Michigan.
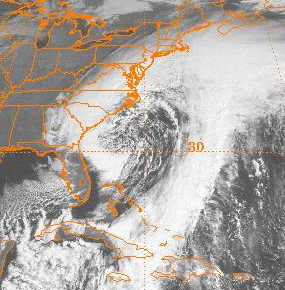
The November 2006 nor'easter was a powerful extratropical cyclone that formed offshore of the Southeastern United States on November 20, bringing heavy rains, high winds, beach erosion, and coastal flooding to the Carolinas and southern New England. In addition, the earliest snowfall ever noted in both Charleston, South Carolina and Savannah, Georgia occurred on the southwest side of this cyclone. Over 10,000 were without power during the storm. No longer a nor'easter, the extratropical cyclone accelerated rapidly across the North Atlantic while rapidly strengthening, becoming a cyclonic storm again by November 25, but this time with hurricane-force sustained winds. The intense low made a cyclonic loop west of Iceland, before being absorbed by another strengthening extratropical cyclone to the west of Great Britain, late on December 1.

Surface weather observations are the fundamental data used for safety as well as climatological reasons to forecast weather and issue warnings worldwide. They can be taken manually, by a weather observer, by computer through the use of automated weather stations, or in a hybrid scheme using weather observers to augment the otherwise automated weather station. The ICAO defines the International Standard Atmosphere (ISA), which is the model of the standard variation of pressure, temperature, density, and viscosity with altitude in the Earth's atmosphere, and is used to reduce a station pressure to sea level pressure. Airport observations can be transmitted worldwide through the use of the METAR observing code. Personal weather stations taking automated observations can transmit their data to the United States mesonet through the Citizen Weather Observer Program (CWOP), the UK Met Office through their Weather Observations Website (WOW), or internationally through the Weather Underground Internet site. A thirty-year average of a location's weather observations is traditionally used to determine the station's climate. In the US a network of Cooperative Observers make a daily record of summary weather and sometimes water level information.

The Ocean Prediction Center (OPC), established in 1995, is one of the National Centers for Environmental Prediction's (NCEP's) original six service centers. Until 2003, the name of the organization was the Marine Prediction Center. Its origins are traced back to the sinking of the RMS Titanic in 1912. The OPC issues forecasts up to five days in advance for ocean areas north of 31° north latitude and west of 35° west longitude in the Atlantic, and across the northeast Pacific north of 30° north latitude and east of 160° east longitude. Until recently, the OPC provided forecast points for tropical cyclones north of 20° north latitude and east of the 60° west longitude to the National Hurricane Center. OPC is composed of two branches: the Ocean Forecast Branch and the Ocean Applications Branch.

On March 2 and 3, 2012, a deadly tornado outbreak occurred over a large section of the Southern United States into the Ohio Valley region. The storms resulted in 41 tornado-related fatalities, 22 of which occurred in Kentucky. Tornado-related deaths also occurred in Alabama, Indiana, and Ohio. The outbreak was the second deadliest in early March for the U.S. since official records began in 1950; only the 1966 Candlestick Park tornado had a higher death toll for a tornadic system in early March.

The Tuvalu Meteorological Service (TMS) is the principal meteorological observatory of Tuvalu and is responsible for providing weather services to the islands of Tuvalu. A meteorological office was established on Funafuti at the time the islands of Tuvalu were administered as parts of the Gilbert and Ellice Islands colony of the United Kingdom. The meteorological office is now an agency of the government of Tuvalu.

On December 23, 2015, an outbreak of supercell thunderstorms produced tornadoes across northern Mississippi and middle Tennessee, resulting in 13 tornado-related deaths and numerous injuries. Other tornadoes occurred as far north as Indiana and Michigan. Scattered tornado activity continued over the next two days before the outbreak ended. This was the first of two deadly tornado outbreaks to impact the southern United States during December 2015 with the other occurring just a day after this one ended.

The December 2015 North American storm complex, also known as Winter Storm Goliath, was a major storm complex that produced a tornado outbreak, a winter storm, a blizzard and an ice storm in areas ranging from the Southwestern United States to New England. Tornadoes struck the Dallas–Fort Worth metroplex in Texas while several other states, especially Missouri, were affected by heavy rain and snow causing severe floods. As the system moved through the Great Lakes, heavy rain, ice pellets and heavy snow fell in the entire region. Wintry mix moved through southern Ontario and Quebec had significant snowfall on December 29. Almost 60 people were killed during the storm system's progression and aftermath, making it one of the deadliest such systems of 2015 in the United States.
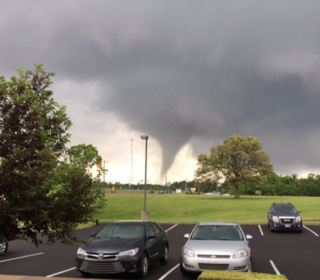
A significant four-day outbreak of tornadoes impacted areas across the High Plains, central Midwest, and parts of the Ohio Valley in early May. The outbreak also produced the first EF4 tornado of the year in Katie, Oklahoma on May 9, where one death occurred. An EF3 tornado near Connerville, Oklahoma also killed a person that day. Other notable tornadoes included two large EF2 tornadoes in Colorado on May 7, a large EF2 tornado near Catherine, Kansas on May 8, and a destructive EF3 tornado that struck Mayfield, Kentucky on May 10. Overall, 57 tornadoes were confirmed.

A late-season tornado outbreak in the Southern United States affected the states of Louisiana, Mississippi, Alabama, and Georgia, from the afternoon of November 29 into the morning of November 30, 2022. The outbreak was the result of an intense upper-level trough that materialized over the aforementioned states where increased moisture, atmospheric instability, and elevated wind shear were present, creating conditions highly conducive to supercell thunderstorms. Multiple tornadic storms developed in the risk area, producing numerous tornadoes. Several of these tornadoes were strong and destructive, prompting the issuance of multiple PDS tornado warnings. Two low-end EF3 tornadoes caused severe damage near Clarks, Louisiana and Tibbie, Alabama respectively while the Flatwood and Willow Springs communities north of Montgomery, Alabama was struck by an EF2 tornado, which caused two fatalities. Numerous weaker tornadoes also touched down, including a high-end EF1 tornado that caused considerable damage in Eutaw, Alabama. In all, 27 tornadoes were confirmed.
References
- ↑ "NATIONAL WEATHER SERVICE PRODUCT/SERVICE DESCRIPTION DOCUMENT (PDD)" (PDF). Retrieved 13 September 2020.
| | This article about atmospheric science is a stub. You can help Wikipedia by expanding it. |