Case control studies are relatively inexpensive and less time-consuming than cohort studies.[citation needed] Since case control studies don't track patients over time, they can't establish relative risk. The case control study can, however, calculate the exposure-odds ratio, which, mathematically, is supposed to approach the relative risk as prevalence falls.
Sander Greenland showed that if the prevalence is 10% or less, the disease can be considered rare enough to allow the rare disease assumption.[2] Unfortunately, the magnitude of discrepancy between the odds ratio and the relative risk is dependent not only on the prevalence, but also, to a great degree, on two other factors.[3][4] Thus, the reliance on the rare disease assumption when discussing odds ratios as risk should be explicitly stated and discussed.
Mathematical proof
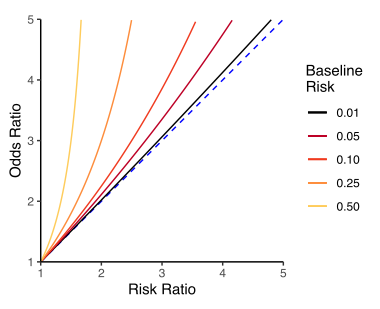
Risk Ratio vs Odds Ratio depending on the baseline risk (prevalence) in the low risk group.
The rare disease assumption can be demonstrated mathematically using the definitions for relative risk and odds ratio.[1]
As prevalence decreases, the number of positive cases decreases. As approaches 0, then and , individually, also approaches 0. In other words, as approaches 0,
.
Examples
The following example illustrates one of the problems, which occurs when the effects are large because the disease is common in the exposed or unexposed group. Consider the following contingency table.
Disease Positive
Disease Negative
Exposure
4
6
No Exposure
5
85
and
While the prevalence is only 9% (9/100), the odds ratio (OR) is equal to 11.3 and the relative risk (RR) is equal to 7.2. Despite fulfilling the rare disease assumption overall, the OR and RR can hardly be considered to be approximately the same. However, the prevalence in the exposed group is 40%, which means is not sufficiently small compared to and therefore .
Disease Positive
Disease Negative
Exposure
4
96
No Exposure
5
895
and
With a prevalence of 0.9% (9/1000) and no changes to the effect size (same RR as above), estimates for RR and OR converge. Sometimes the prevalence threshold for which the rare disease assumption holds may be much lower.
↑ Greenland, S.; Thomas, D. C.; Morgenstern, H. (1986). "The rare-disease assumption revisited. A critique of "estimators of relative risk for case-control studies"". American Journal of Epidemiology. 124 (6): 869–883. doi:10.1093/oxfordjournals.aje.a114476. ISSN0002-9262. PMID3776970.
↑ Fletcher, Robert H. (8 January 2013). Clinical epidemiology: the essentials. Fletcher, Suzanne W.,, Fletcher, Grant S. (5thed.). Philadelphia. ISBN978-1-4698-2625-7. OCLC859337100.{{cite book}}: CS1 maint: location missing publisher (link)
This page is based on this Wikipedia article Text is available under the CC BY-SA 4.0 license; additional terms may apply. Images, videos and audio are available under their respective licenses.