
Rendering is the process of generating a photorealistic or non-photorealistic image from input data such as 3D models. The word "rendering" originally meant the task performed by an artist when depicting a real or imaginary thing. Today, to "render" commonly means to generate an image or video from a precise description using a computer program.
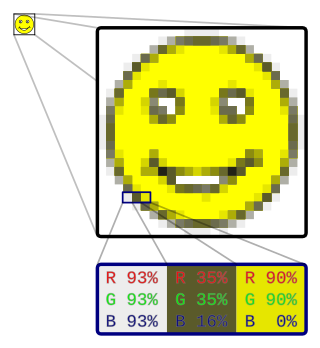
In computer graphics and digital photography, a raster graphic represents a two-dimensional picture as a rectangular matrix or grid of pixels, viewable via a computer display, paper, or other display medium. A raster image is technically characterized by the width and height of the image in pixels and by the number of bits per pixel. Raster images are stored in image files with varying dissemination, production, generation, and acquisition formats.
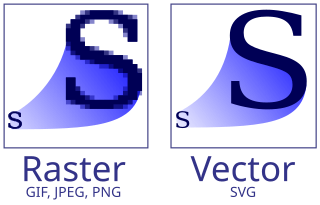
Vector graphics are a form of computer graphics in which visual images are created directly from geometric shapes defined on a Cartesian plane, such as points, lines, curves and polygons. The associated mechanisms may include vector display and printing hardware, vector data models and file formats, as well as the software based on these data models. Vector graphics are an alternative to raster or bitmap graphics, with each having advantages and disadvantages in specific situations.
A raster graphics editor is a computer program that allows users to create and edit images interactively on the computer screen and save them in one of many raster graphics file formats such as JPEG, PNG, and GIF.

In computer graphics, rasterisation or rasterization is the task of taking an image described in a vector graphics format (shapes) and converting it into a raster image. The rasterized image may then be displayed on a computer display, video display or printer, or stored in a bitmap file format. Rasterization may refer to the technique of drawing 3D models, or to the conversion of 2D rendering primitives, such as polygons and line segments, into a rasterized format.
Digital Imaging and Communications in Medicine (DICOM) is a technical standard for the digital storage and transmission of medical images and related information. It includes a file format definition, which specifies the structure of a DICOM file, as well as a network communication protocol that uses TCP/IP to communicate between systems. The primary purpose of the standard is to facilitate communication between the software and hardware entities involved in medical imaging, especially those that are created by different manufacturers. Entities that utilize DICOM files include components of picture archiving and communication systems (PACS), such as imaging machines (modalities), radiological information systems (RIS), scanners, printers, computing servers, and networking hardware.

A framebuffer is a portion of random-access memory (RAM) containing a bitmap that drives a video display. It is a memory buffer containing data representing all the pixels in a complete video frame. Modern video cards contain framebuffer circuitry in their cores. This circuitry converts an in-memory bitmap into a video signal that can be displayed on a computer monitor.

A voxel is a three-dimensional counterpart to a pixel. It represents a value on a regular grid in a three-dimensional space. Voxels are frequently used in the visualization and analysis of medical and scientific data. They are also commonly used in video games, both as a technological feature, as in Outcast, and a graphical style, which was popularised by Minecraft.
The BMP file format, or bitmap, is a raster graphics image file format used to store bitmap digital images, independently of the display device, especially on Microsoft Windows and OS/2 operating systems.
QuickDraw was the 2D graphics library and associated application programming interface (API) which is a core part of classic Mac OS. It was initially written by Bill Atkinson and Andy Hertzfeld. QuickDraw still existed as part of the libraries of Mac OS X, but had been largely superseded by the more modern Quartz graphics system. In Mac OS X Tiger, QuickDraw has been officially deprecated. In Mac OS X Leopard applications using QuickDraw cannot make use of the added 64-bit support. In OS X Mountain Lion, QuickDraw header support was removed from the operating system. Applications using QuickDraw still ran under OS X Mountain Lion to macOS High Sierra; however, the current versions of Xcode and the macOS SDK do not contain the header files to compile such programmes.
A GIS file format is a standard for encoding geographical information into a computer file, as a specialized type of file format for use in geographic information systems (GIS) and other geospatial applications. Since the 1970s, dozens of formats have been created based on various data models for various purposes. They have been created by government mapping agencies, GIS software vendors, standards bodies such as the Open Geospatial Consortium, informal user communities, and even individual developers.
Transparency in computer graphics is possible in a number of file formats. The term "transparency" is used in various ways by different people, but at its simplest there is "full transparency" i.e. something that is completely invisible. Only part of a graphic should be fully transparent, or there would be nothing to see. More complex is "partial transparency" or "translucency" where the effect is achieved that a graphic is partially transparent in the same way as colored glass. Since ultimately a printed page or computer or television screen can only be one color at a point, partial transparency is always simulated at some level by mixing colors. There are many different ways to mix colors, so in some cases transparency is ambiguous.
The computer graphics pipeline, also known as the rendering pipeline, or graphics pipeline, is a framework within computer graphics that outlines the necessary procedures for transforming a three-dimensional (3D) scene into a two-dimensional (2D) representation on a screen. Once a 3D model is generated, the graphics pipeline converts the model into a visually perceivable format on the computer display. Due to the dependence on specific software, hardware configurations, and desired display attributes, a universally applicable graphics pipeline does not exist. Nevertheless, graphics application programming interfaces (APIs), such as Direct3D, OpenGL and Vulkan were developed to standardize common procedures and oversee the graphics pipeline of a given hardware accelerator. These APIs provide an abstraction layer over the underlying hardware, relieving programmers from the need to write code explicitly targeting various graphics hardware accelerators like AMD, Intel, Nvidia, and others.
An image file format is a file format for a digital image. There are many formats that can be used, such as JPEG, PNG, and GIF. Most formats up until 2022 were for storing 2D images, not 3D ones. The data stored in an image file format may be compressed or uncompressed. If the data is compressed, it may be done so using lossy compression or lossless compression. For graphic design applications, vector formats are often used. Some image file formats support transparency.
In computer graphics, image tracing, raster-to-vector conversion or raster vectorization is the conversion of raster graphics into vector graphics.
The following are common definitions related to the machine vision field.
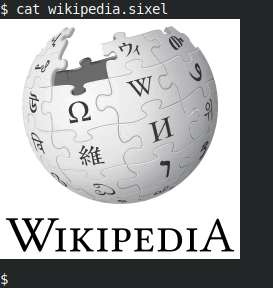
Sixel, short for "six pixels", is a bitmap graphics format supported by terminals and printers from DEC. It consists of a pattern six pixels high and one wide, resulting in 64 possible patterns. Each possible pattern is assigned an ASCII character, making the sixels easy to transmit on 7-bit serial links.
In computing, a bitmap graphic is an image formed from rows of different colored pixels. A GIF is an example of a graphics image file that uses a bitmap.
A geographic data model, geospatial data model, or simply data model in the context of geographic information systems, is a mathematical and digital structure for representing phenomena over the Earth. Generally, such data models represent various aspects of these phenomena by means of geographic data, including spatial locations, attributes, change over time, and identity. For example, the vector data model represents geography as collections of points, lines, and polygons, and the raster data model represent geography as cell matrices that store numeric values. Data models are implemented throughout the GIS ecosystem, including the software tools for data management and spatial analysis, data stored in a variety of GIS file formats, specifications and standards, and specific designs for GIS installations.
This is a glossary of terms relating to computer graphics.

