Tasmanian state election, 21 August 1948 [1] Contents | ||||||
---|---|---|---|---|---|---|
Enrolled voters | 161,088 | |||||
Votes cast | 148,588 | Turnout | 92.24% | +1.17% | ||
Informal votes | 5,866 | Informal | 3.95% | –6.13% | ||
Summary of votes by party | ||||||
Party | Primary votes | % | Swing | Seats | Change | |
Labor | 70,476 | 49.38% | –1.59% | 15 | – 1 | |
Liberal | 54,010 | 37.84% | +3.59% | 12 | ± 0 | |
Ind. Lib. | 9,729 | 6.82% | –1.96% | 1 | ± 0 | |
Independent | 8,330 | 5.84% | –0.17% | 2 | + 1 | |
Total | 142,722 | 30 |
This is a list of House of Assembly results for the 1948 Tasmanian election.
Party | Candidate | Votes | % | ±% | |
---|---|---|---|---|---|
Quota | 3,819 | ||||
Labor | John Madden (elected 1) | 4,501 | 16.8 | +1.2 | |
Labor | Reg Turnbull (elected 2) | 3,953 | 14.8 | -1.4 | |
Labor | Eric Howroyd (elected 4) | 2,286 | 8.6 | -0.1 | |
Labor | Alexander Atkins | 1,632 | 6.1 | +0.3 | |
Labor | John Carter | 1,625 | 6.1 | +1.3 | |
Labor | Henry Hurst | 940 | 3.5 | +3.5 | |
Liberal | Fred Marriott (elected 3) | 3,225 | 12.1 | +4.0 | |
Liberal | John Orchard (elected 6) | 2,249 | 8.4 | +8.4 | |
Liberal | John Steer | 2,083 | 7.8 | +7.8 | |
Liberal | Bill Beattie (elected 5) | 2,074 | 7.8 | +0.5 | |
Liberal | Jack Breheny | 1,068 | 4.0 | +4.0 | |
Liberal | Allen Hollingsworth | 917 | 3.4 | -2.4 | |
Liberal | Stewart Chapple | 178 | 0.7 | +0.7 | |
Total formal votes | 26,731 | 96.8 | +7.7 | ||
Informal votes | 888 | 3.2 | -7.7 | ||
Turnout | 27,619 | 89.8 | -1.1 | ||
Party total votes | |||||
Labor | 14,937 | 55.9 | -2.0 | ||
Liberal | 11,794 | 44.1 | +12.2 | ||
Party | Candidate | Votes | % | ±% | |
---|---|---|---|---|---|
Quota | 4,182 | ||||
Labor | Eric Reece (elected 1) | 5,255 | 18.0 | +2.9 | |
Labor | Charley Aylett (elected 2) | 4,018 | 13.7 | +1.4 | |
Labor | Carrol Bramich (elected 5) | 1,784 | 6.1 | +1.9 | |
Labor | Aubrey Bartram | 1,488 | 5.1 | +5.1 | |
Labor | Michael Smith | 777 | 2.7 | -1.6 | |
Labor | Harold Purton | 646 | 2.2 | +2.2 | |
Liberal | Jack Chamberlain (elected 3) | 3,684 | 12.6 | -0.2 | |
Liberal | John Fidler (elected 4) | 2,350 | 8.0 | -3.0 | |
Liberal | Gerald Acheson | 2,044 | 7.0 | +0.9 | |
Liberal | Kevin Lyons (elected 6) | 1,567 | 5.4 | +5.4 | |
Liberal | Percy Williams | 1,361 | 4.6 | +0.8 | |
Liberal | James Hilder | 939 | 3.2 | +3.2 | |
Liberal | Vivian Byard | 927 | 3.2 | +3.2 | |
Liberal | Wilfred French | 505 | 1.7 | +1.7 | |
Independent | Henry McFie | 1,498 | 5.1 | +5.1 | |
Independent | Leslie Margetts | 274 | 0.9 | +0.9 | |
Independent | Ellis Batten | 155 | 0.5 | +0.5 | |
Total formal votes | 29,272 | 95.5 | +3.5 | ||
Informal votes | 1,382 | 4.5 | -3.5 | ||
Turnout | 30,654 | 94.6 | +4.5 | ||
Party total votes | |||||
Labor | 13,968 | 47.7 | -1.8 | ||
Liberal | 13,377 | 45.7 | -2.0 | ||
Independent | 1,927 | 6.6 | +6.6 | ||
Party | Candidate | Votes | % | ±% | |
---|---|---|---|---|---|
Quota | 3,960 | ||||
Labor | Robert Cosgrove (elected 1) | 5,642 | 20.4 | +3.6 | |
Labor | Alfred White (elected 3) | 3,106 | 11.2 | +3.0 | |
Labor | John Nolan | 1,119 | 4.0 | +0.5 | |
Labor | Henry Hope (elected 5) | 1,046 | 3.8 | +3.8 | |
Labor | Albert Bowring | 518 | 1.9 | +1.9 | |
Labor | Timothy Mahoney | 494 | 1.8 | +1.8 | |
Labor | Norman Cooper | 419 | 1.5 | +1.5 | |
Liberal | Horace Strutt (elected 6) | 1,484 | 5.4 | +1.1 | |
Liberal | Campbell Duncan | 1,409 | 5.1 | +5.1 | |
Liberal | John Kennedy | 984 | 3.6 | +3.6 | |
Liberal | Wilfred Osborne | 552 | 2.0 | +2.0 | |
Liberal | Joyce Heathorn | 457 | 1.6 | -1.1 | |
Liberal | Robert Harvey | 391 | 1.4 | -0.8 | |
Liberal | Hubert Lewis | 309 | 1.1 | +1.1 | |
Liberal | Gerald Lyons | 201 | 0.7 | +0.7 | |
Group C | Rex Townley (elected 2) | 5,535 | 20.0 | -12.0 | |
Group C | Edgar Lee | 228 | 0.8 | +0.8 | |
Group A | Bill Wedd (elected 4) | 2,820 | 10.2 | +10.2 | |
Group A | Victor Ratten | 484 | 1.7 | +1.7 | |
Group A | Cyril Hosan | 61 | 0.2 | +0.2 | |
Independent | Thomas Layton | 282 | 1.0 | +1.0 | |
Independent | George Wallis | 175 | 0.6 | +0.6 | |
Total formal votes | 27,716 | 95.5 | +6.5 | ||
Informal votes | 1,304 | 4.5 | -6.5 | ||
Turnout | 29,020 | 90.1 | +0.1 | ||
Party total votes | |||||
Labor | 12,344 | 44.5 | -0.8 | ||
Liberal | 5,787 | 20.9 | +1.5 | ||
Group C | 5,763 | 20.8 | -11.2 | ||
Group A | 3,365 | 12.1 | +12.1 | ||
Independent | Thomas Layton | 282 | 1.0 | +1.0 | |
Independent | George Wallis | 175 | 0.6 | +0.6 | |
Party | Candidate | Votes | % | ±% | |
---|---|---|---|---|---|
Quota | 4,735 | ||||
Labor | John Dwyer (elected 1) | 5,423 | 16.4 | +8.8 | |
Labor | Bill Neilson (elected 4) | 3,471 | 10.5 | +2.6 | |
Labor | Charles Hand (elected 3) | 3,249 | 9.8 | +4.4 | |
Labor | Rowland Worsley | 1,591 | 4.8 | +4.8 | |
Labor | John Brown | 1,443 | 4.4 | +2.6 | |
Labor | Marjorie Somerville | 667 | 2.0 | +2.0 | |
Liberal | Reg Wright (elected 2) | 5,226 | 15.8 | +1.5 | |
Liberal | Tim Jackson (elected 5) | 2,395 | 7.2 | +1.8 | |
Liberal | Archibald Park | 1,725 | 5.2 | +1.0 | |
Liberal | Olive Calvert | 733 | 2.2 | +2.2 | |
Liberal | Ronald Morrisby | 658 | 2.0 | +2.0 | |
Liberal | Artur Griffiths | 475 | 1.4 | +1.4 | |
Group Independent | George Gray (elected 6) | 2,754 | 8.3 | +1.2 | |
Group Independent | Thomas Pearsall | 2,041 | 6.2 | +6.2 | |
Group Independent | Arthur Cross | 578 | 1.7 | +1.7 | |
Group Independent | Royce Turnbull | 519 | 1.6 | +1.6 | |
Independent | Leonard Martin | 124 | 0.4 | +0.4 | |
Independent | Henry Martin | 70 | 0.2 | +0.2 | |
Total formal votes | 33,142 | 95.9 | +6.4 | ||
Informal votes | 1,415 | 4.1 | -6.4 | ||
Turnout | 34,557 | 93.9 | +1.4 | ||
Party total votes | |||||
Labor | 15,844 | 47.8 | -3.7 | ||
Liberal | 11,212 | 33.8 | -1.4 | ||
Group Independent | 5,892 | 17.8 | +4.5 | ||
Independent | Leonard Martin | 124 | 0.4 | +0.4 | |
Independent | Henry Martin | 70 | 0.2 | +0.2 | |
Party | Candidate | Votes | % | ±% | |
---|---|---|---|---|---|
Quota | 3,695 | ||||
Labor | Roy Fagan (elected 2) | 5,172 | 20.0 | +8.6 | |
Labor | Lancelot Spurr (elected 6) | 2,232 | 8.6 | -2.6 | |
Labor | Peter Pike (elected 5) | 2,229 | 8.6 | -1.5 | |
Labor | Charles Burnell | 1,882 | 7.3 | +1.5 | |
Labor | Douglas Cashion | 1,266 | 4.9 | +0.8 | |
Labor | Henry Gregg | 602 | 2.3 | +2.3 | |
Liberal | Neil Campbell (elected 1) | 5,748 | 22.2 | +6.8 | |
Liberal | Robert Wordsworth | 1,736 | 6.7 | +6.7 | |
Liberal | Robert Robertson (elected 4) | 1,343 | 5.2 | -1.7 | |
Liberal | Charles Best | 1,252 | 4.8 | +4.8 | |
Liberal | Angus Bethune (elected 3) | 1,154 | 4.5 | -0.3 | |
Liberal | Leslie Brown | 607 | 2.3 | +2.3 | |
Independent | Thomas Churchward-Kelly | 638 | 2.5 | +2.5 | |
Total formal votes | 25,861 | 96.7 | +6.8 | ||
Informal votes | 877 | 3.3 | -6.8 | ||
Turnout | 26,738 | 92.5 | +0.6 | ||
Party total votes | |||||
Labor | 13,383 | 51.7 | +0.5 | ||
Liberal | 11,840 | 45.8 | +9.5 | ||
Independent | Thomas Churchward-Kelly | 638 | 2.5 | +2.5 | |
The House of Assembly, or Lower House, is one of the two chambers of the Parliament of Tasmania in Australia. The other is the Legislative Council or Upper House. It sits in Parliament House in the state capital, Hobart.
The 1998 Tasmanian state election was held on Saturday, 29 August 1998 in the Australian state of Tasmania to elect 25 members of the Tasmanian House of Assembly. The number of members was reduced from 35 to 25. The election used the Hare-Clark proportional representation system—five members were elected from each of five electorates. The quota required for election increased from 12.5% to 16.7%.
The 1986 Tasmanian state election was held on 8 February 1986 in the Australian state of Tasmania to elect 35 members of the Tasmanian House of Assembly. The election used the Hare-Clark proportional representation system — seven members were elected from each of five electorates. The quota required for election was 12.5% in each division.
The 1969 Tasmanian state election was held on 10 May 1969 in the Australian state of Tasmania to elect 35 members of the Tasmanian House of Assembly. The election used the Hare-Clark proportional representation system — seven members were elected from each of five electorates.
The 1972 Tasmanian state election was held on 22 April 1972 in the Australian state of Tasmania to elect 35 members of the Tasmanian House of Assembly. The election used the Hare-Clark proportional representation system — seven members were elected from each of five electorates.
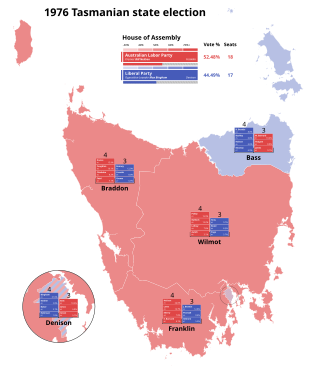
The 1976 Tasmanian state election was held on 11 December 1976 in the Australian state of Tasmania to elect 35 members of the Tasmanian House of Assembly. The election used the Hare-Clark proportional representation system — seven members were elected from each of five electorates.
The 1979 Tasmanian state election was held on 28 July 1979 in the Australian state of Tasmania to elect 35 members of the Tasmanian House of Assembly. The election used the Hare-Clark proportional representation system — seven members were elected from each of five electorates. The quota required for election was 12.5% in each division.
The 1913 Tasmanian state election was held on Thursday, 23 January 1913 in the Australian state of Tasmania to elect 30 members of the Tasmanian House of Assembly. The election used the Hare-Clark proportional representation system — six members were elected from each of five electorates.
The 1916 Tasmanian state election was held on Saturday, 25 March 1916 in the Australian state of Tasmania to elect 30 members of the Tasmanian House of Assembly. The election used the Hare-Clark proportional representation system — six members were elected from each of five electorates.
The 1931 Tasmanian state election was held on 9 May 1931 in the Australian state of Tasmania to elect 30 members of the Tasmanian House of Assembly. The election used the Hare-Clark proportional representation system — six members were elected from each of five electorates. For the first time, voting was compulsory, resulting in a high voter turnout.
The 1946 Tasmanian state election was held on 23 November 1946 in the Australian state of Tasmania to elect 30 members of the Tasmanian House of Assembly. The election used the Hare-Clark proportional representation system — six members were elected from each of five electorates.
The 1948 Tasmanian state election was held on 21 August 1948 in the Australian state of Tasmania to elect 30 members of the Tasmanian House of Assembly. The election used the Hare-Clark proportional representation system — six members were elected from each of five electorates.
The 1950 Tasmanian state election was held on 6 May 1950 in the Australian state of Tasmania to elect 30 members of the Tasmanian House of Assembly. The election used the Hare-Clark proportional representation system — six members were elected from each of five electorates.
The 1955 Tasmanian state election was held on 19 February 1955 in the Australian state of Tasmania to elect 30 members of the Tasmanian House of Assembly. The election used the Hare-Clark proportional representation system — six members were elected from each of five electorates.
The 1956 Tasmanian state election was held on 13 October 1956 in the Australian state of Tasmania to elect 30 members of the Tasmanian House of Assembly. The election used the Hare-Clark proportional representation system — six members were elected from each of five electorates.
The 1959 Tasmanian state election was held on 2 May 1959 in the Australian state of Tasmania to elect 35 members of the Tasmanian House of Assembly. The number of members were increased from this election from 30 to 35. The election used the Hare-Clark proportional representation system — seven members were elected from each of five electorates.
The 1964 Tasmanian state election was held on 2 May 1964 in the Australian state of Tasmania to elect 35 members of the Tasmanian House of Assembly. The election used the Hare-Clark proportional representation system — seven members were elected from each of five electorates.
This is a list of members of the Tasmanian Legislative Council between 1945 and 1951. Terms of the Legislative Council did not coincide with Legislative Assembly elections, and members served six year terms, with a number of members facing election each year.
This is a list of members of the Tasmanian House of Assembly between the 23 November 1946 election and the 21 August 1948 election. The Nationalist Party had dissolved and its members had joined the new Liberal Party by the time of the election.
This is a list of House of Assembly results for the 1946 Tasmanian election.