Tasmanian state election, 13 October 1956 [1] Contents | ||||||
---|---|---|---|---|---|---|
Enrolled voters | 174,632 | |||||
Votes cast | 166,293 | Turnout | 95.22 | +1.30 | ||
Informal votes | 6,968 | Informal | 4.19 | +0.40 | ||
Summary of votes by party | ||||||
Party | Primary votes | % | Swing | Seats | Change | |
Labor | 80,096 | 50.27 | –2.36 | 15 | ± 0 | |
Liberal | 69,477 | 43.61 | –1.74 | 15 | ± 0 | |
Labor (Anti-Communist) | 5,522 | 3.47 | +3.47 | 0 | ± 0 | |
Independent | 4,139 | 2.60 | +0.58 | 0 | ± 0 | |
Communist | 91 | 0.06 | +0.06 | 0 | ± 0 | |
Total | 159,325 | 30 |
This is a list of House of Assembly results for the 1956 Tasmanian election.
Party | Candidate | Votes | % | ±% | |
---|---|---|---|---|---|
Quota | 4,593 | ||||
Labor | Claude Barnard (elected 1) | 5,159 | 16.0 | +2.0 | |
Labor | Reg Turnbull (elected 2) | 4,570 | 14.2 | +3.5 | |
Labor | Alexander Atkins (elected 6) | 3,209 | 10.0 | +1.2 | |
Labor | John Madden | 2,445 | 7.6 | -4.3 | |
Labor | Ronald Cocker | 783 | 2.4 | +2.4 | |
Labor | Wallace Fraser | 390 | 1.2 | -1.5 | |
Liberal | Bill Beattie (elected 3) | 4,252 | 13.2 | +2.5 | |
Liberal | Fred Marriott (elected 4) | 3,326 | 10.3 | +0.7 | |
Liberal | John Steer (elected 5) | 3,177 | 9.9 | -2.1 | |
Liberal | William Fry | 2,906 | 9.0 | +2.0 | |
Liberal | Ralph Fleming | 631 | 2.0 | +2.0 | |
Labor (A-C) | Virgil Morgan | 1,228 | 3.8 | +3.8 | |
Labor (A-C) | Clement Pollington | 73 | 0.2 | +0.2 | |
Total formal votes | 32,149 | 95.3 | -0.6 | ||
Informal votes | 1,569 | 4.7 | +0.6 | ||
Turnout | 33,718 | 95.0 | +1.1 | ||
Party total votes | |||||
Labor | 16,556 | 51.5 | -2.0 | ||
Liberal | 14,292 | 44.5 | -1.5 | ||
Labor (A-C) | 1,301 | 4.0 | +4.0 | ||
Party | Candidate | Votes | % | ±% | |
---|---|---|---|---|---|
Quota | 4,510 | ||||
Labor | Eric Reece (elected 1) | 5,983 | 19.0 | -2.0 | |
Labor | Sydney Ward (elected 3) | 3,805 | 12.1 | +5.7 | |
Labor | Charley Aylett (elected 4) | 2,673 | 8.5 | -1.5 | |
Labor | Frank Taylor | 1,641 | 5.2 | +5.2 | |
Labor | Cyril Cameron | 613 | 1.9 | +1.9 | |
Labor | John Keating | 587 | 1.9 | +1.9 | |
Liberal | Carrol Bramich (elected 2) | 5,467 | 17.3 | +17.3 | |
Liberal | Kevin Lyons (elected 5) | 2,882 | 9.1 | -1.4 | |
Liberal | John Fidler | 2,461 | 7.8 | -3.4 | |
Liberal | Jack Breheny (elected 6) | 2,409 | 7.6 | -5.5 | |
Liberal | Edward Gaby | 919 | 2.9 | -1.7 | |
Liberal | Trevor Frampton | 676 | 2.1 | -2.2 | |
Labor (A-C) | Terence Doody | 638 | 2.0 | +2.0 | |
Labor (A-C) | Timothy Healy | 538 | 1.7 | +1.7 | |
Labor (A-C) | Albin Galpin | 134 | 0.4 | +0.4 | |
Independent | Roger Miller | 139 | 0.4 | +0.4 | |
Total formal votes | 31,565 | 96.6 | -0.2 | ||
Informal votes | 1,115 | 3.4 | +0.2 | ||
Turnout | 32,680 | 95.3 | -1.5 | ||
Party total votes | |||||
Labor | 15,302 | 48.5 | -4.8 | ||
Liberal | 14,814 | 46.9 | +0.2 | ||
Labor (A-C) | 1,310 | 4.2 | +4.2 | ||
Independent | Roger Miller | 139 | 0.4 | +0.4 | |
Party | Candidate | Votes | % | ±% | |
---|---|---|---|---|---|
Quota | 4,938 | ||||
Labor | Robert Cosgrove (elected 1) | 10,050 | 29.1 | +4.7 | |
Labor | Alfred White (elected 6) | 2,444 | 7.1 | -1.9 | |
Labor | Brian Miller | 2,029 | 5.9 | +5.9 | |
Labor | Frank Gaha (elected 3) | 1,277 | 3.7 | -0.8 | |
Labor | Bert Lacey | 623 | 1.8 | +1.8 | |
Labor | Eric Howroyd | 414 | 1.2 | +1.2 | |
Liberal | Rex Townley (elected 2) | 10,030 | 29.0 | -2.3 | |
Liberal | Bill Hodgman (elected 5) | 1,391 | 4.0 | 0.0 | |
Liberal | Gordon Cashmore | 1,239 | 3.6 | +3.6 | |
Liberal | Horace Strutt (elected 4) | 1,094 | 3.2 | +1.4 | |
Liberal | Alfred Robertson | 362 | 1.0 | +1.0 | |
Liberal | William Stanton | 201 | 0.6 | -0.1 | |
Group D | Bill Wedd | 1,896 | 5.5 | -1.2 | |
Group D | Terry Bower | 460 | 1.3 | +1.3 | |
Labor (A-C) | Jack Bartholomew | 418 | 1.2 | +1.2 | |
Labor (A-C) | Anthony Orpwood | 414 | 1.2 | +1.2 | |
Labor (A-C) | Cyril Marshall | 68 | 0.2 | +0.2 | |
Communist | Max Bound | 91 | 0.3 | +0.3 | |
Independent | William Lloyd | 59 | 0.2 | +0.2 | |
Total formal votes | 34,560 | 95.9 | -0.3 | ||
Informal votes | 1,496 | 4.1 | +0.3 | ||
Turnout | 36,056 | 95.1 | +2.7 | ||
Party total votes | |||||
Labor | 16,837 | 48.7 | -2.1 | ||
Liberal | 14,317 | 41.4 | -1.1 | ||
Group D | 2,356 | 6.8 | +0.1 | ||
Labor (A-C) | 900 | 2.6 | +2.6 | ||
Communist | 91 | 0.3 | +0.3 | ||
Independent | William Lloyd | 59 | 0.2 | +0.2 | |
Party | Candidate | Votes | % | ±% | |
---|---|---|---|---|---|
Quota | 4,246 | ||||
Labor | John Dwyer (elected 2) | 4,747 | 16.0 | +1.2 | |
Labor | Bill Neilson (elected 3) | 3,729 | 12.5 | -0.9 | |
Labor | Brian Crawford (elected 6) | 2,813 | 9.5 | +3.7 | |
Labor | Charles Hand | 2,211 | 7.4 | -1.8 | |
Labor | James Percey | 723 | 2.4 | +2.4 | |
Labor | Clyde McNally | 343 | 1.2 | +1.2 | |
Liberal | Tim Jackson (elected 1) | 5,508 | 18.5 | +10.3 | |
Liberal | Thomas Pearsall (elected 5) | 2,438 | 8.2 | -1.7 | |
Liberal | Doug Clark | 1,947 | 6.6 | +1.1 | |
Liberal | Mabel Miller (elected 4) | 1,924 | 6.5 | -8.7 | |
Liberal | Walter Rayner | 726 | 2.4 | -2.8 | |
Liberal | Tasman Pitman | 208 | 0.7 | +0.7 | |
Independent | Robert McDougall | 1,585 | 5.3 | +5.3 | |
Labor (A-C) | Henry Roberts | 352 | 1.2 | +1.2 | |
Labor (A-C) | Alfred Harrold | 330 | 1.1 | +1.1 | |
Labor (A-C) | Francis Hursey | 133 | 0.4 | +0.4 | |
Total formal votes | 29,717 | 95.7 | -0.5 | ||
Informal votes | 1,345 | 4.3 | +0.5 | ||
Turnout | 31,062 | 95.9 | +1.7 | ||
Party total votes | |||||
Labor | 14,566 | 49.0 | -0.9 | ||
Liberal | 12,751 | 42.9 | -3.6 | ||
Independent | Robert McDougall | 1,585 | 5.3 | +5.3 | |
Labor (A-C) | 815 | 2.7 | +2.7 | ||
Party | Candidate | Votes | % | ±% | |
---|---|---|---|---|---|
Quota | 4,477 | ||||
Labor | Roy Fagan (elected 1) | 5,280 | 16.9 | -1.5 | |
Labor | Reg Fisher (elected 3) | 3,523 | 11.2 | -2.8 | |
Labor | Douglas Cashion (elected 2) | 3,344 | 10.7 | -2.3 | |
Labor | Lancelot Spurr | 2,046 | 6.5 | -1.6 | |
Labor | William McNeil | 1,554 | 5.0 | -0.1 | |
Labor | Ralph Taylor | 1,088 | 3.5 | +3.5 | |
Liberal | Angus Bethune (elected 4) | 3,290 | 10.5 | +2.0 | |
Liberal | Bert Bessell (elected 6) | 2,754 | 8.8 | +8.8 | |
Liberal | Charles Best (elected 5) | 2,724 | 8.7 | -3.7 | |
Liberal | Amelia Best | 1,884 | 6.0 | -2.4 | |
Liberal | Ian Gibson | 1,758 | 5.6 | +5.6 | |
Liberal | John Strickland | 893 | 2.8 | +2.8 | |
Labor (A-C) | Owen Doherty | 662 | 2.1 | +2.1 | |
Labor (A-C) | Cyril Maloney | 362 | 1.2 | +1.2 | |
Labor (A-C) | John Reidy | 172 | 0.5 | +0.5 | |
Total formal votes | 31,334 | 95.6 | -0.4 | ||
Informal votes | 1,443 | 4.4 | +0.4 | ||
Turnout | 32,777 | 94.8 | -0.2 | ||
Party total votes | |||||
Labor | 16,835 | 53.7 | -2.0 | ||
Liberal | 13,303 | 42.5 | -1.8 | ||
Labor (A-C) | 1,196 | 3.8 | +3.8 | ||
The House of Assembly, or Lower House, is one of the two chambers of the Parliament of Tasmania in Australia. The other is the Legislative Council or Upper House. It sits in Parliament House in the state capital, Hobart.
The Tasmanian Legislative Council is the upper house of the Parliament of Tasmania in Australia. It is one of the two chambers of the Parliament, the other being the House of Assembly. Both houses sit in Parliament House in the state capital, Hobart. Members of the Legislative Council are often referred to as MLCs.
The Parliament of Tasmania is the bicameral legislature of the Australian state of Tasmania. It follows a Westminster-derived parliamentary system and consists of the King, the Tasmanian House of Assembly, and Tasmanian Legislative Council. Since 1841, both Houses have met in Parliament House, Hobart. The Parliament of Tasmania first met in 1856.
The 1922 Tasmanian state election was held on 10 June 1922 in the Australian state of Tasmania to elect 30 members of the Tasmanian House of Assembly. The election used the Hare-Clark proportional representation system — six members were elected from each of five electorates.
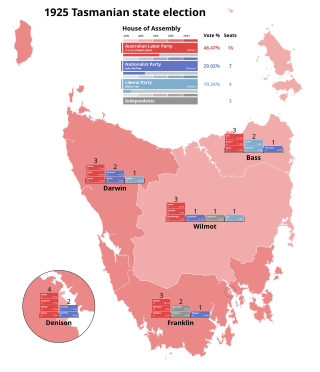
The 1925 Tasmanian state election was held on Wednesday, 3 June 1925 in the Australian state of Tasmania to elect 30 members of the Tasmanian House of Assembly. The election used the Hare-Clark proportional representation system — six members were elected from each of five electorates.
The 1955 Tasmanian state election was held on 19 February 1955 in the Australian state of Tasmania to elect 30 members of the Tasmanian House of Assembly. The election used the Hare-Clark proportional representation system — six members were elected from each of five electorates.
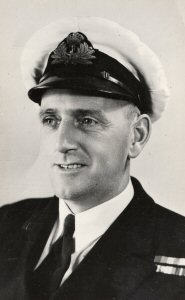
The 1956 Tasmanian state election was held on 13 October 1956 in the Australian state of Tasmania to elect 30 members of the Tasmanian House of Assembly. The election used the Hare-Clark proportional representation system — six members were elected from each of five electorates.
The electoral district of West Launceston, sometimes referred to as Launceston West, was a single-member electoral district of the Tasmanian House of Assembly. It was based in the western suburbs of Launceston, Tasmania's second city.
The electoral district of Launceston was a multi-member electoral district of the Tasmanian House of Assembly. It was based in Tasmania's second city, Launceston, and the surrounding rural area.
The electoral district of North Launceston, sometimes referred to as Launceston North, was an electoral district of the Tasmanian House of Assembly. It was based in Tasmania's second city, Launceston, and the surrounding rural area.
The electoral district of North Hobart, sometimes referred to as Hobart North, was an electoral district of the Tasmanian House of Assembly. It was based in Tasmania's capital city, Hobart.
The electoral district of East Hobart, sometimes referred to as Hobart East, is an electoral district of the Tasmanian House of Assembly. It is based in Tasmania's capital city, Hobart and has been historically difficult to find.
The electoral district of Central Hobart, sometimes referred to as Hobart Central, was an electoral district of the Tasmanian House of Assembly. It was based in Tasmania's capital city, Hobart.
The electoral district of South Hobart, sometimes referred to as Hobart South, was an electoral district of the Tasmanian House of Assembly. It was based in Tasmania's capital city, Hobart.
The electoral district of West Hobart, sometimes referred to as Hobart West, was an electoral district of the Tasmanian House of Assembly. It was based in Tasmania's capital city, Hobart.
The electoral district of Queensborough was an electoral district of the Tasmanian House of Assembly. It was based in the southern suburbs of Tasmania's capital city, Hobart, in particular Sandy Bay, and surrounding districts such as Cascades, Taroona and Kingston.
The Electoral district of Wellington was an electoral district of the Tasmanian House of Assembly. It was based in north-western Tasmania in the town of Stanley, and included King Island. The seat extended as far east as Wynyard and Burnie until 1903 when the Burnie seat was created.
William George Wedd was an Australian politician and member of the Tasmanian House of Assembly and Tasmanian Legislative Council. He was Speaker of the Tasmanian House of Assembly from 13 September 1949 to 6 June 1950.

The Tasmanian Nationals are a political party in the Australian state of Tasmania, aligned with the National Party of Australia. The party is not currently registered with the Tasmanian Electoral Commission, and is not separately registered with the Australian Electoral Commission, unlike the other state branches of the Nationals.