Tasmanian state election, 2 May 1959 [1] Contents | ||||||
---|---|---|---|---|---|---|
Enrolled voters | 180,344 | |||||
Votes cast | 170,559 | Turnout | 94.57 | –0.65 | ||
Informal votes | 9,816 | Informal | 5.76 | +1.57 | ||
Summary of votes by party | ||||||
Party | Primary votes | % | Swing | Seats | Change | |
Labor | 71,535 | 44.50 | –5.77 | 17 | + 2 | |
Liberal | 66,005 | 41.05 | –2.54 | 16 | + 1 | |
Democratic Labor | 8,510 | 5.29 | +1.82 | 0 | ± 0 | |
Independent | 14,549 | 9.05 | +6.45 | 2 | + 2 | |
Communist | 144 | 0.09 | +0.03 | 0 | ± 0 | |
Total | 160,743 | 35 |
This is a list of House of Assembly results for the 1959 Tasmanian election.
Party | Candidate | Votes | % | ±% | |
---|---|---|---|---|---|
Quota | 4,057 | ||||
Liberal | Bill Beattie (elected 4) | 2,621 | 8.1 | −5.1 | |
Liberal | John Steer (elected 6) | 2,603 | 8.0 | −1.9 | |
Liberal | Fred Marriott (elected 7) | 2,444 | 7.5 | −2.8 | |
Liberal | James McGowen | 1,855 | 5.7 | +5.7 | |
Liberal | Max Bushby | 1,578 | 4.9 | +4.9 | |
Liberal | Lionel Abbott | 555 | 1.7 | +1.7 | |
Liberal | Harold Pope | 119 | 0.4 | +0.4 | |
Labor | John Madden (elected 2) | 3,056 | 9.4 | +1.8 | |
Labor | Alexander Atkins (elected 3) | 2,497 | 7.7 | −2.3 | |
Labor | Harold Newman | 1,493 | 4.6 | +4.6 | |
Labor | Mac Le Fevre (elected 5) | 1,469 | 4.5 | +4.5 | |
Labor | Frank Taylor | 1,100 | 3.4 | +3.4 | |
Labor | Wallace Fraser | 642 | 2.0 | +0.8 | |
Group B | Reg Turnbull (elected 1) | 9,065 | 27.9 | +27.9 | |
Group B | William Shipp | 205 | 0.6 | +0.6 | |
Democratic Labor | Leslie Arnold | 1,149 | 3.5 | +3.5 | |
Total formal votes | 32,451 | 93.5 | −1.8 | ||
Informal votes | 2,256 | 6.5 | +1.8 | ||
Turnout | 34,707 | 95.0 | 0.0 | ||
Party total votes | |||||
Liberal | 11,775 | 36.3 | −8.2 | ||
Labor | 10,257 | 31.6 | −19.9 | ||
Group B | 9,270 | 28.6 | +28.6 | ||
Democratic Labor | 1,149 | 3.5 | −0.5 |
Party | Candidate | Votes | % | ±% | |
---|---|---|---|---|---|
Quota | 3,983 | ||||
Labor | Eric Reece (elected 1) | 9,688 | 30.4 | +11.4 | |
Labor | Sydney Ward (elected 2) | 2,511 | 7.9 | −4.2 | |
Labor | Lloyd Costello (elected 4) | 1,756 | 5.5 | +5.5 | |
Labor | Joseph Britton (elected 5) | 1,067 | 3.3 | +3.3 | |
Labor | Aubrey Gaffney | 582 | 1.8 | +1.8 | |
Labor | Patrick Streets | 541 | 1.7 | +1.7 | |
Labor | Harold Singleton | 472 | 1.5 | +1.5 | |
Liberal | Kevin Lyons (elected 7) | 3,084 | 9.7 | +0.6 | |
Liberal | Jack Breheny (elected 6) | 3,071 | 9.6 | +2.0 | |
Liberal | Carrol Bramich (elected 3) | 2,588 | 8.1 | −9.2 | |
Liberal | William Young | 2,134 | 6.7 | +6.7 | |
Liberal | Horace Lane | 1,125 | 3.5 | +3.5 | |
Liberal | Arthur Abel | 932 | 2.9 | +2.9 | |
Liberal | Charles Rand | 579 | 1.8 | +1.8 | |
Democratic Labor | Frances Lane | 750 | 2.4 | +2.4 | |
Democratic Labor | Bruce Cameron | 742 | 2.3 | +2.3 | |
Democratic Labor | Alban Galpin | 102 | 0.3 | −0.1 | |
Independent | Eric Nicholls | 133 | 0.4 | +0.4 | |
Total formal votes | 31,857 | 95.1 | −1.5 | ||
Informal votes | 1,654 | 4.9 | +1.5 | ||
Turnout | 33,511 | 94.2 | −1.1 | ||
Party total votes | |||||
Labor | 16,617 | 52.2 | +3.7 | ||
Liberal | 13,513 | 42.4 | −4.5 | ||
Democratic Labor | 1,594 | 5.0 | +0.8 | ||
Independent | Eric Nicholls | 133 | 0.4 | +0.4 |
Party | Candidate | Votes | % | ±% | |
---|---|---|---|---|---|
Quota | 4,106 | ||||
Liberal | Rex Townley (elected 1) | 8,251 | 25.1 | −3.9 | |
Liberal | Archibald Park (elected 7) | 1,332 | 4.1 | +4.1 | |
Liberal | Bill Hodgman (elected 6) | 1,064 | 3.2 | −0.8 | |
Liberal | Donald Clark | 996 | 3.0 | +3.0 | |
Liberal | Harold Solomon | 765 | 2.3 | +2.3 | |
Liberal | Horace Strutt | 650 | 2.0 | −1.2 | |
Labor | Frank Gaha (elected 3) | 3,033 | 9.2 | +5.5 | |
Labor | Harry McLoughlin (elected 4) | 2,575 | 7.8 | +7.8 | |
Labor | Charley Aylett (elected 5) | 2,451 | 7.5 | +7.5 | |
Labor | Mary Cumming | 1,608 | 4.9 | +4.9 | |
Labor | Bert Lacey | 1,430 | 4.4 | +2.6 | |
Labor | William Wilkinson | 961 | 2.9 | +2.9 | |
Labor | Eric Howroyd | 912 | 2.8 | +1.6 | |
Independent | Bill Wedd (elected 2) | 3,075 | 9.4 | +3.9 | |
Democratic Labor | Harold Senior | 1,133 | 3.4 | +3.4 | |
Democratic Labor | Brian Bresnehan | 725 | 2.2 | +2.2 | |
Democratic Labor | Rex McShane | 380 | 1.2 | +1.2 | |
Independent | Nigel Abbott | 1,356 | 4.1 | +4.1 | |
Communist | Max Bound | 126 | 0.4 | +0.4 | |
Communist | George Chenery | 18 | 0.1 | +0.1 | |
Total formal votes | 32,841 | 93.6 | −2.3 | ||
Informal votes | 2,241 | 6.4 | +2.3 | ||
Turnout | 35,082 | 94.5 | −0.6 | ||
Party total votes | |||||
Liberal | 13,058 | 39.8 | −1.6 | ||
Labor | 12,970 | 39.5 | −9.2 | ||
Independent | Bill Wedd | 3,075 | 9.4 | +3.9 | |
Democratic Labor | 2,238 | 6.8 | +4.2 | ||
Independent | Nigel Abbott | 1,356 | 4.1 | +4.1 | |
Communist | 144 | 0.4 | +0.4 |
Party | Candidate | Votes | % | ±% | |
---|---|---|---|---|---|
Quota | 4,014 | ||||
Labor | Bill Neilson (elected 2) | 4,123 | 12.8 | +0.3 | |
Labor | John Dwyer (elected 3) | 3,478 | 10.8 | −5.2 | |
Labor | Eric Barnard (elected 5) | 2,580 | 8.0 | +8.0 | |
Labor | Colin Brooker | 1,833 | 5.7 | +5.7 | |
Labor | Brian Crawford | 1,702 | 5.3 | −4.2 | |
Labor | Lynda Heaven | 767 | 2.4 | +2.4 | |
Labor | James Percey | 378 | 1.2 | −1.2 | |
Liberal | Tim Jackson (elected 1) | 4,416 | 13.8 | −4.7 | |
Liberal | Thomas Pearsall (elected 6) | 2,339 | 7.3 | −0.9 | |
Liberal | Bill Young (elected 7) | 2,246 | 7.0 | +7.0 | |
Liberal | Mabel Miller (elected 4) | 2,042 | 6.4 | −0.1 | |
Liberal | Donald Cuthbertson | 1,183 | 3.7 | +3.7 | |
Liberal | Stanley Gough | 953 | 3.0 | +3.0 | |
Liberal | Richard Tallboys | 888 | 2.8 | +2.8 | |
Democratic Labor | Virgil Morgan | 1,116 | 3.5 | +3.5 | |
Democratic Labor | John Dwyer | 844 | 2.6 | +2.6 | |
Democratic Labor | Henry Scoles | 321 | 1.0 | +1.0 | |
Democratic Labor | Allan Powell | 186 | 0.6 | +0.6 | |
Independent | Leo McPartlan | 406 | 1.3 | +1.3 | |
Independent | Terry Bower | 190 | 0.6 | +0.6 | |
Independent | Francis Hursey | 119 | 0.4 | +0.4 | |
Total formal votes | 32,110 | 94.1 | −1.6 | ||
Informal votes | 2,001 | 5.9 | +1.6 | ||
Turnout | 34,111 | 95.4 | −0.5 | ||
Party total votes | |||||
Labor | 14,861 | 46.3 | −2.7 | ||
Liberal | 14,067 | 43.8 | +0.9 | ||
Democratic Labor | 2,467 | 7.7 | +5.0 | ||
Independent | Leo McPartlan | 406 | 1.3 | +1.3 | |
Independent | Terry Bower | 190 | 0.6 | +0.6 | |
Independent | Francis Hursey | 119 | 0.4 | +0.4 |
Party | Candidate | Votes | % | ±% | |
---|---|---|---|---|---|
Quota | 3,936 | ||||
Labor | Roy Fagan (elected 1) | 5,402 | 17.2 | +0.3 | |
Labor | Douglas Cashion (elected 2) | 2,806 | 8.9 | −1.8 | |
Labor | William Anderson | 1,997 | 6.3 | +6.3 | |
Labor | William McNeil (elected 5) | 1,983 | 6.3 | +1.3 | |
Labor | Thomas McDonald (elected 4) | 1,944 | 6.2 | +6.2 | |
Labor | Lancelot Spurr | 1,881 | 6.0 | −0.5 | |
Labor | Norman Dixon | 817 | 2.6 | +2.6 | |
Liberal | Bert Bessell (elected 6) | 2,799 | 8.9 | +0.1 | |
Liberal | Angus Bethune (elected 3) | 2,744 | 8.7 | −1.8 | |
Liberal | Bob Ingamells (elected 7) | 2,709 | 8.6 | +8.6 | |
Liberal | Ian Gibson | 2,205 | 7.0 | +1.4 | |
Liberal | Leslie Brown | 2,117 | 6.7 | +6.7 | |
Liberal | Amelia Best | 1,018 | 3.2 | −2.8 | |
Democratic Labor | Harold Hill | 1,062 | 3.4 | +3.4 | |
Total formal votes | 31,484 | 95.0 | −0.6 | ||
Informal votes | 1,664 | 5.0 | +0.6 | ||
Turnout | 33,148 | 93.7 | −1.1 | ||
Party total votes | |||||
Labor | 16,830 | 53.5 | −0.2 | ||
Liberal | 13,592 | 43.2 | +0.7 | ||
Democratic Labor | 1,062 | 3.4 | +3.4 |
The House of Assembly, or Lower House, is one of the two chambers of the Parliament of Tasmania in Australia. The other is the Legislative Council or Upper House. It sits in Parliament House in the state capital, Hobart.
Michelle Anne O'Byrne is Australian politician for the Australian Labor Party and since May 2024, the Speaker of the Tasmanian House of Assembly.
The 1986 Tasmanian state election was held on 8 February 1986 in the Australian state of Tasmania to elect 35 members of the Tasmanian House of Assembly. The election used the Hare-Clark proportional representation system — seven members were elected from each of five electorates. The quota required for election was 12.5% in each division.
The 1969 Tasmanian state election was held on 10 May 1969 in the Australian state of Tasmania to elect 35 members of the Tasmanian House of Assembly. The election used the Hare-Clark proportional representation system — seven members were elected from each of five electorates.
The 1972 Tasmanian state election was held on 22 April 1972 in the Australian state of Tasmania to elect 35 members of the Tasmanian House of Assembly. The election used the Hare-Clark proportional representation system — seven members were elected from each of five electorates.
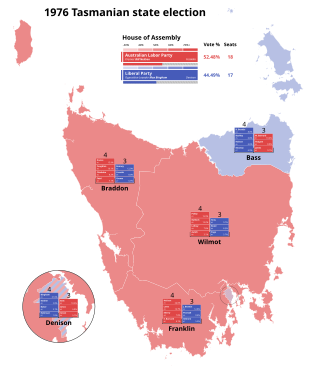
The 1976 Tasmanian state election was held on 11 December 1976 in the Australian state of Tasmania to elect 35 members of the Tasmanian House of Assembly. The election used the Hare-Clark proportional representation system — seven members were elected from each of five electorates.
The 1979 Tasmanian state election was held on 28 July 1979 in the Australian state of Tasmania to elect 35 members of the Tasmanian House of Assembly. The election used the Hare-Clark proportional representation system — seven members were elected from each of five electorates. The quota required for election was 12.5% in each division.
The 1913 Tasmanian state election was held on Thursday, 23 January 1913 in the Australian state of Tasmania to elect 30 members of the Tasmanian House of Assembly. The election used the Hare-Clark proportional representation system — six members were elected from each of five electorates.
The 1916 Tasmanian state election was held on Saturday, 25 March 1916 in the Australian state of Tasmania to elect 30 members of the Tasmanian House of Assembly. The election used the Hare-Clark proportional representation system — six members were elected from each of five electorates.
The 1919 Tasmanian state election was held on 31 May 1919 in the Australian state of Tasmania to elect 30 members of the Tasmanian House of Assembly. The election used the Hare-Clark proportional representation system — six members were elected from each of five electorates.
The 1931 Tasmanian state election was held on 9 May 1931 in the Australian state of Tasmania to elect 30 members of the Tasmanian House of Assembly. The election used the Hare-Clark proportional representation system — six members were elected from each of five electorates. For the first time, voting was compulsory, resulting in a high voter turnout.
The 1955 Tasmanian state election was held on 19 February 1955 in the Australian state of Tasmania to elect 30 members of the Tasmanian House of Assembly. The election used the Hare-Clark proportional representation system — six members were elected from each of five electorates.
The 1956 Tasmanian state election was held on 13 October 1956 in the Australian state of Tasmania to elect 30 members of the Tasmanian House of Assembly. The election used the Hare-Clark proportional representation system — six members were elected from each of five electorates.
The 1959 Tasmanian state election was held on 2 May 1959 in the Australian state of Tasmania to elect 35 members of the Tasmanian House of Assembly. The number of members were increased from this election from 30 to 35. The election used the Hare-Clark proportional representation system — seven members were elected from each of five electorates.
The 1964 Tasmanian state election was held on 2 May 1964 in the Australian state of Tasmania to elect 35 members of the Tasmanian House of Assembly. The election used the Hare-Clark proportional representation system — seven members were elected from each of five electorates.
This is a list of members of the Tasmanian Legislative Council between 1957 and 1963. Terms of the Legislative Council did not coincide with Legislative Assembly elections, and members served six year terms, with a number of members facing election each year.
This is a list of members of the Tasmanian House of Assembly between the 13 October 1956 election and the 2 May 1959 election. The previous Darwin division had been renamed Braddon after former Premier of Tasmania Sir Edward Braddon.
This is a list of members of the Tasmanian House of Assembly between the 2 May 1959 election and the 2 May 1964 election. Prior to this election, each of the five Tasmanian seats had been expanded from 6 to 7 members to provide an odd number of members, due mainly to a series of hung parliaments.
William George Wedd was an Australian politician and member of the Tasmanian House of Assembly and Tasmanian Legislative Council. He was Speaker of the Tasmanian House of Assembly from 13 September 1949 to 6 June 1950.
This is a list of House of Assembly results for the 1956 Tasmanian election.