Tasmanian state election, 2 May 1964 [1] Contents | ||||||
---|---|---|---|---|---|---|
Enrolled voters | 193,418 | |||||
Votes cast | 184,571 | Turnout | 95.43 | +0.86 | ||
Informal votes | 7,980 | Informal | 4.32 | –1.44 | ||
Summary of votes by party | ||||||
Party | Primary votes | % | Swing | Seats | Change | |
Labor | 90,631 | 51.32 | +6.82 | 19 | + 2 | |
Liberal | 67,971 | 38.49 | –2.57 | 16 | ± 0 | |
Country | 9,280 | 5.26 | +5.26 | 0 | ± 0 | |
Democratic Labor | 3,155 | 1.79 | –3.50 | 0 | ± 0 | |
Communist | 92 | 0.05 | –0.04 | 0 | ± 0 | |
Independent | 5,462 | 3.09 | –5.96 | 0 | – 2 | |
Total | 176,591 | 35 |
This is a list of House of Assembly results for the 1964 Tasmanian election.
Party | Candidate | Votes | % | ±% | |
---|---|---|---|---|---|
Quota | 4,383 | ||||
Labor | Alexander Atkins (elected 2) | 4,104 | 11.7 | +4.0 | |
Labor | John Madden (elected 4) | 3,667 | 10.5 | +1.1 | |
Labor | Mac Le Fevre (elected 3) | 3,514 | 10.0 | +5.5 | |
Labor | Wallace Fraser (elected 7) | 1,872 | 5.3 | +3.3 | |
Labor | Laurence Lovett | 1,273 | 3.6 | +3.6 | |
Labor | Norman Laurence | 1,145 | 3.3 | +3.3 | |
Labor | Harold Holmes | 1,013 | 2.9 | +2.9 | |
Labor | Eric Down | 899 | 2.6 | +2.6 | |
Liberal | Bill Beattie (elected 1) | 3,807 | 10.9 | +2.8 | |
Liberal | John Steer (elected 6) | 3,119 | 8.9 | +0.9 | |
Liberal | Max Bushby (elected 5) | 2,825 | 8.1 | +3.2 | |
Liberal | James McGowen | 1,453 | 4.1 | -1.6 | |
Liberal | James Henty | 1,375 | 3.9 | +3.9 | |
Liberal | Stewart Chapple | 1,243 | 3.5 | +3.5 | |
Liberal | Jack Hookway | 544 | 1.6 | +1.6 | |
Liberal | Kevin Hendstock | 93 | 0.3 | +0.3 | |
Country | Geoffrey Finney | 637 | 1.8 | +1.8 | |
Country | Keith Darcey | 620 | 1.8 | +1.8 | |
Country | Colin Rattray | 496 | 1.4 | +1.4 | |
Country | Graeme Millar | 141 | 0.4 | +0.4 | |
Democratic Labor | Edward Hare | 440 | 1.3 | +1.3 | |
Democratic Labor | Frederick Kaye | 244 | 0.7 | +0.7 | |
Group A | Leslie Arnold | 301 | 0.9 | -2.6 | |
Group A | Jack Harper | 178 | 0.5 | +0.5 | |
Independent | Brian Johnson | 57 | 0.2 | +0.2 | |
Total formal votes | 35,060 | 95.0 | +1.5 | ||
Informal votes | 1,837 | 5.0 | −1.5 | ||
Turnout | 36,897 | 95.3 | +0.3 | ||
Party total votes | |||||
Labor | 17,487 | 49.9 | +18.3 | ||
Liberal | 14,459 | 41.2 | +4.9 | ||
Country | 1,894 | 5.4 | +5.4 | ||
Democratic Labor | 684 | 2.0 | +2.0 | ||
Group A | 479 | 1.4 | -2.1 | ||
Independent | Brian Johnson | 57 | 0.2 | +0.2 |
Party | Candidate | Votes | % | ±% | |
---|---|---|---|---|---|
Quota | 4,428 | ||||
Labor | Eric Reece (elected 1) | 12,291 | 34.7 | +4.3 | |
Labor | Lloyd Costello (elected 3) | 2,184 | 6.2 | +0.7 | |
Labor | Sydney Ward (elected 2) | 1,807 | 5.1 | -2.8 | |
Labor | Geoff Chisholm (elected 4) | 1,528 | 4.3 | +4.3 | |
Labor | Douglas Blacklow | 761 | 2.1 | +2.1 | |
Labor | Joseph Britton | 674 | 1.9 | -1.4 | |
Labor | Gordon O'Shannessey | 483 | 1.4 | +1.4 | |
Labor | Richard Sleath | 304 | 0.9 | +0.9 | |
Liberal | Kevin Lyons (elected 5) | 2,958 | 8.4 | -1.3 | |
Liberal | Jack Breheny (elected 7) | 2,565 | 7.2 | -2.4 | |
Liberal | William Young | 2,117 | 6.0 | -0.7 | |
Liberal | Wilfred Barker (elected 6) | 2,087 | 5.9 | +5.9 | |
Liberal | John Leary | 609 | 1.7 | +1.7 | |
Liberal | Ray Grey | 504 | 1.4 | +1.4 | |
Liberal | Ernest Johnson | 372 | 1.1 | +1.1 | |
Liberal | Loch Roberts | 332 | 0.9 | +0.9 | |
Liberal | Charles MacKenzie | 124 | 0.4 | +0.4 | |
Country | Roger Chalk | 769 | 2.2 | +2.2 | |
Country | Anthony Hine | 570 | 1.6 | +1.6 | |
Country | Eric Webster | 472 | 1.3 | +1.3 | |
Country | Elliott Hooper | 399 | 1.1 | +1.1 | |
Country | Thomas Barnard | 370 | 1.0 | +1.0 | |
Country | Gilbert Allen | 341 | 1.0 | +1.0 | |
Democratic Labor | Ronald Cole | 660 | 1.9 | +1.9 | |
Democratic Labor | John Mortimer | 99 | 0.3 | +0.3 | |
Democratic Labor | Abraham Neut | 38 | 0.1 | +0.1 | |
Total formal votes | 35,418 | 96.6 | +1.5 | ||
Informal votes | 1,248 | 3.4 | −1.5 | ||
Turnout | 36,666 | 95.6 | +1.4 | ||
Party total votes | |||||
Labor | 20,032 | 56.6 | +4.4 | ||
Liberal | 11,668 | 32.9 | -9.5 | ||
Country | 2,921 | 8.2 | +8.2 | ||
Democratic Labor | 797 | 2.3 | -2.7 |
Party | Candidate | Votes | % | ±% | |
---|---|---|---|---|---|
Quota | 4,151 | ||||
Liberal | Rex Townley (elected 1) | 8,903 | 26.8 | +1.7 | |
Liberal | Nigel Abbott (elected 3) | 2,117 | 6.4 | +6.4 | |
Liberal | Robert Mather (elected 5) | 1,742 | 5.2 | +5.2 | |
Liberal | George Brown | 981 | 3.0 | +3.0 | |
Liberal | Horace Strutt (elected 6) | 578 | 1.7 | -0.3 | |
Liberal | Donald Clark | 308 | 0.9 | -2.1 | |
Liberal | Gladys Schott | 281 | 0.8 | +0.8 | |
Labor | Harry McLoughlin (elected 2) | 4,200 | 12.6 | +4.8 | |
Labor | Merv Everett (elected 4) | 3,453 | 10.4 | +10.4 | |
Labor | Ken Austin (elected 7) | 1,632 | 4.9 | +4.9 | |
Labor | Neville Lovell | 1,397 | 4.2 | +4.2 | |
Labor | Mary Cumming | 1,356 | 4.1 | -0.8 | |
Labor | Myron Tripp | 1,209 | 3.6 | +3.6 | |
Labor | Eric Howroyd | 696 | 2.1 | -0.7 | |
Labor | Henry Hope | 680 | 2.0 | +2.0 | |
Group A | Bill Wedd | 1,140 | 3.4 | -6.0 | |
Group A | John Clemente | 653 | 2.0 | +2.0 | |
Independent | Harold Senior | 1,086 | 3.3 | +3.3 | |
Independent | Bill Hodgman | 475 | 1.4 | +1.4 | |
Independent | Stanislaus Ryan | 125 | 0.4 | +0.4 | |
Independent | Charley Aylett | 102 | 0.3 | +0.3 | |
Communist | Max Bound | 92 | 0.3 | -0.1 | |
Total formal votes | 33,206 | 95.5 | +1.9 | ||
Informal votes | 1,579 | 4.5 | −1.9 | ||
Turnout | 34,785 | 94.0 | −0.5 | ||
Party total votes | |||||
Liberal | 14,910 | 44.9 | +5.1 | ||
Labor | 14,623 | 44.0 | +4.5 | ||
Group A | 1,793 | 5.4 | -4.0 | ||
Independent | Harold Senior | 1,086 | 3.3 | +3.3 | |
Independent | Bill Hodgman | 475 | 1.4 | +1.4 | |
Independent | Stanislaus Ryan | 125 | 0.4 | +0.4 | |
Independent | Charley Aylett | 102 | 0.3 | +0.3 | |
Communist | 92 | 0.3 | -0.1 |
Party | Candidate | Votes | % | ±% | |
---|---|---|---|---|---|
Quota | 4,978 | ||||
Labor | Bill Neilson (elected 1) | 8,548 | 21.5 | +8.7 | |
Labor | Eric Barnard (elected 2) | 4,980 | 12.5 | +4.5 | |
Labor | Terry Martin (elected 3) | 3,279 | 8.2 | +8.2 | |
Labor | Jack Frost (elected 5) | 1,383 | 3.5 | +3.5 | |
Labor | William Blackburn | 995 | 2.5 | +2.5 | |
Labor | Ken Wriedt | 768 | 1.9 | +1.9 | |
Labor | Clyde Harvey | 645 | 1.6 | +1.6 | |
Labor | Lynda Heaven | 592 | 1.5 | -0.9 | |
Liberal | Thomas Pearsall (elected 4) | 3,880 | 9.7 | +2.4 | |
Liberal | Bill Young (elected 7) | 3,130 | 7.9 | +0.6 | |
Liberal | Mabel Miller | 2,268 | 5.7 | -0.7 | |
Liberal | Doug Clark (elected 6) | 2,074 | 5.2 | +5.2 | |
Liberal | Ken Lowrie | 1,299 | 3.3 | +3.3 | |
Liberal | Eric Iles | 1,187 | 3.0 | +3.0 | |
Liberal | Jan Meldrum | 688 | 1.7 | +1.7 | |
Country | James Skinner | 617 | 1.5 | +1.5 | |
Country | Vernon Rae | 472 | 1.2 | +1.2 | |
Country | Gordon Suhr | 369 | 0.9 | +0.9 | |
Country | Kathleen Reynolds | 292 | 0.7 | +0.7 | |
Country | Murrum Sweet | 104 | 0.3 | +0.3 | |
Independent | Tim Jackson | 1,062 | 2.7 | +2.7 | |
Democratic Labor | Virgil Morgan | 1,059 | 2.7 | -0.8 | |
Independent | George Carr | 132 | 0.3 | +0.3 | |
Total formal votes | 39,823 | 95.3 | +1.2 | ||
Informal votes | 1,957 | 4.7 | −1.2 | ||
Turnout | 41,780 | 96.2 | +0.8 | ||
Party total votes | |||||
Labor | 21,190 | 53.2 | +6.9 | ||
Liberal | 14,526 | 36.5 | -7.3 | ||
Country | 1,854 | 4.7 | +4.7 | ||
Independent | Tim Jackson | 1,062 | 2.7 | +2.7 | |
Democratic Labor | 1,059 | 2.7 | -0.8 | ||
Independent | George Carr | 132 | 0.3 | +0.3 |
Party | Candidate | Votes | % | ±% | |
---|---|---|---|---|---|
Quota | 4,136 | ||||
Labor | Roy Fagan (elected 1) | 5,508 | 16.6 | -0.6 | |
Labor | Douglas Cashion (elected 3) | 4,060 | 12.3 | +3.4 | |
Labor | William Anderson (elected 6) | 2,739 | 8.3 | +2.0 | |
Labor | Thomas McDonald (elected 7) | 2,421 | 7.3 | +1.1 | |
Labor | William McNeil | 1,601 | 4.8 | -1.5 | |
Labor | Henry Penny | 572 | 1.7 | +1.7 | |
Labor | Archibald Wilson | 398 | 1.2 | +1.2 | |
Liberal | Angus Bethune (elected 2) | 5,142 | 15.5 | +6.8 | |
Liberal | Bob Ingamells (elected 4) | 2,778 | 8.4 | -0.2 | |
Liberal | Bert Bessell (elected 5) | 2,581 | 7.8 | -1.1 | |
Liberal | Kenneth O'Brien | 1,019 | 3.1 | +3.1 | |
Liberal | Ronald Johnstone | 667 | 2.0 | +2.0 | |
Liberal | Henry Clark | 221 | 0.7 | +0.7 | |
Country | Bernard Taylor | 636 | 1.9 | +1.9 | |
Country | Allen Brown | 587 | 1.8 | +1.8 | |
Country | William Dunbabin | 579 | 1.8 | +1.8 | |
Country | Maxwell Oliver | 572 | 1.7 | +1.7 | |
Country | Solomon Henderson | 237 | 0.7 | +0.7 | |
Democratic Labor | Alastair Davidson | 499 | 1.5 | +1.5 | |
Democratic Labor | Harold Grace | 116 | 0.4 | +0.4 | |
Independent | Bruce Hill | 151 | 0.5 | +0.5 | |
Total formal votes | 33,084 | 96.1 | +1.1 | ||
Informal votes | 1,359 | 3.9 | −1.1 | ||
Turnout | 34,443 | 95.9 | +2.2 | ||
Party total votes | |||||
Labor | 17,299 | 52.3 | -1.2 | ||
Liberal | 12,408 | 37.5 | -5.7 | ||
Country | 2,611 | 7.9 | +7.9 | ||
Democratic Labor | 615 | 1.9 | +1.9 | ||
Independent | Bruce Hill | 151 | 0.5 | +0.5 |
The House of Assembly, or Lower House, is one of the two chambers of the Parliament of Tasmania in Australia. The other is the Legislative Council or Upper House. It sits in Parliament House in the state capital, Hobart.
The 1986 Tasmanian state election was held on 8 February 1986 in the Australian state of Tasmania to elect 35 members of the Tasmanian House of Assembly. The election used the Hare-Clark proportional representation system — seven members were elected from each of five electorates. The quota required for election was 12.5% in each division.
The 1969 Tasmanian state election was held on 10 May 1969 in the Australian state of Tasmania to elect 35 members of the Tasmanian House of Assembly. The election used the Hare-Clark proportional representation system — seven members were elected from each of five electorates.
The 1972 Tasmanian state election was held on 22 April 1972 in the Australian state of Tasmania to elect 35 members of the Tasmanian House of Assembly. The election used the Hare-Clark proportional representation system — seven members were elected from each of five electorates.
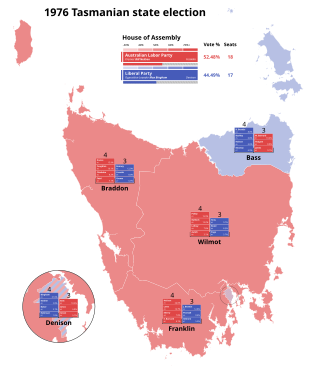
The 1976 Tasmanian state election was held on 11 December 1976 in the Australian state of Tasmania to elect 35 members of the Tasmanian House of Assembly. The election used the Hare-Clark proportional representation system — seven members were elected from each of five electorates.
The 1979 Tasmanian state election was held on 28 July 1979 in the Australian state of Tasmania to elect 35 members of the Tasmanian House of Assembly. The election used the Hare-Clark proportional representation system — seven members were elected from each of five electorates. The quota required for election was 12.5% in each division.
The 1913 Tasmanian state election was held on Thursday, 23 January 1913 in the Australian state of Tasmania to elect 30 members of the Tasmanian House of Assembly. The election used the Hare-Clark proportional representation system — six members were elected from each of five electorates.
The 1916 Tasmanian state election was held on Saturday, 25 March 1916 in the Australian state of Tasmania to elect 30 members of the Tasmanian House of Assembly. The election used the Hare-Clark proportional representation system — six members were elected from each of five electorates.
The 1931 Tasmanian state election was held on 9 May 1931 in the Australian state of Tasmania to elect 30 members of the Tasmanian House of Assembly. The election used the Hare-Clark proportional representation system — six members were elected from each of five electorates. For the first time, voting was compulsory, resulting in a high voter turnout.
The 1950 Tasmanian state election was held on 6 May 1950 in the Australian state of Tasmania to elect 30 members of the Tasmanian House of Assembly. The election used the Hare-Clark proportional representation system — six members were elected from each of five electorates.
The 1955 Tasmanian state election was held on 19 February 1955 in the Australian state of Tasmania to elect 30 members of the Tasmanian House of Assembly. The election used the Hare-Clark proportional representation system — six members were elected from each of five electorates.
The 1956 Tasmanian state election was held on 13 October 1956 in the Australian state of Tasmania to elect 30 members of the Tasmanian House of Assembly. The election used the Hare-Clark proportional representation system — six members were elected from each of five electorates.
The 1959 Tasmanian state election was held on 2 May 1959 in the Australian state of Tasmania to elect 35 members of the Tasmanian House of Assembly. The number of members were increased from this election from 30 to 35. The election used the Hare-Clark proportional representation system — seven members were elected from each of five electorates.
The 1964 Tasmanian state election was held on 2 May 1964 in the Australian state of Tasmania to elect 35 members of the Tasmanian House of Assembly. The election used the Hare-Clark proportional representation system — seven members were elected from each of five electorates.
The Centre Party, previously the Country Party, was a minor Australian political party in the state of Tasmania. Initially formed in 1962 as a new Tasmanian branch of the Country Party of Australia after decades of inactivity in the state, it at first enjoyed no electoral success. In the run up to the 1969 election the party was joined by Kevin Lyons, a former Liberal turned independent member of the Assembly for Braddon, who renamed it the Centre Party and retained his seat at the election, securing the balance of power and serving as Deputy Premier in a coalition government until 1972. Upon the coalition's collapse the Centre Party faded away before being dissolved in 1975.
The Electoral district of Montagu was a single-member electoral district of the Tasmanian House of Assembly. It covered the West Coast region of Tasmania and its main centre of population was the town of Zeehan.
This is a list of members of the Tasmanian House of Assembly between the 2 May 1964 election and the 10 May 1969 election.
William George Wedd was an Australian politician and member of the Tasmanian House of Assembly and Tasmanian Legislative Council. He was Speaker of the Tasmanian House of Assembly from 13 September 1949 to 6 June 1950.
This is a list of House of Assembly results for the 1959 Tasmanian election.

The Tasmanian Nationals are a political party in the Australian state of Tasmania, aligned with the National Party of Australia. The party is not currently registered with the Tasmanian Electoral Commission, and is not separately registered with the Australian Electoral Commission, unlike the other state branches of the Nationals.