Victorian state election, 5 May 1979 [1] Contents | ||||||
---|---|---|---|---|---|---|
Enrolled voters | 2,350,407 | |||||
Votes cast | 2,191,128 | Turnout | 93.22 | +0.03 | ||
Informal votes | 77,361 | Informal | 3.53 | +0.41 | ||
Summary of votes by party | ||||||
Party | Primary votes | % | Swing | Seats won | Seats held | |
Labor | 958,158 | 45.33 | +2.72 | 8 | 13 | |
Liberal | 924,525 | 43.74 | –4.56 | 12 | 27 | |
National | 124,050 | 5.87 | –1.98 | 2 | 4 | |
Democrats | 60,392 | 2.86 | +2.86 | 0 | 0 | |
Democratic Labor | 3,212 | 0.15 | –0.47 | 0 | 0 | |
Independent | 43,430 | 2.05 | +1.56 | 0 | 0 | |
Total | 2,113,767 | 22 | 44 |
This is a list of Legislative Council results for the Victorian 1979 state election. 22 of the 44 seats were contested.
Party | Candidate | Votes | % | ±% | |
---|---|---|---|---|---|
Liberal | Clive Bubb | 43,501 | 52.0 | −6.9 | |
Labor | David Williams | 40,198 | 48.0 | +6.9 | |
Total formal votes | 83,699 | 97.5 | +0.1 | ||
Informal votes | 2,154 | 2.5 | −0.1 | ||
Turnout | 85,853 | 94.9 | −0.1 | ||
Liberal hold | Swing | -6.9 | |||
Party | Candidate | Votes | % | ±% | |
---|---|---|---|---|---|
Labor | Alan Calder | 29,159 | 36.1 | +1.7 | |
Liberal | John Radford | 26,767 | 33.1 | −0.3 | |
National | Stuart McDonald | 18,140 | 22.4 | −5.7 | |
Democrats | Douglas Linford | 6,778 | 8.4 | +8.4 | |
Total formal votes | 80,844 | 97.5 | −0.5 | ||
Informal votes | 2,039 | 2.5 | +0.5 | ||
Turnout | 82,883 | 94.8 | −0.5 | ||
Two-party-preferred result | |||||
Liberal | John Radford | 44,624 | 55.2 | −5.6 | |
Labor | Alan Calder | 36,220 | 44.8 | +5.6 | |
Liberal hold | Swing | -5.6 | |||
Party | Candidate | Votes | % | ±% | |
---|---|---|---|---|---|
Liberal | Gracia Baylor | 56,703 | 49.7 | −7.7 | |
Labor | Richard Coughlin | 52,627 | 46.1 | +3.5 | |
Independent | Peter Brown | 4,730 | 4.2 | +4.2 | |
Total formal votes | 114,060 | 97.2 | +0.1 | ||
Informal votes | 3,266 | 2.8 | −0.1 | ||
Turnout | 117,326 | 94.2 | +1.2 | ||
Two-party-preferred result | |||||
Liberal | Gracia Baylor | 59,359 | 52.0 | −5.4 | |
Labor | Richard Coughlin | 54,701 | 48.0 | +5.4 | |
Liberal hold | Swing | -5.4 | |||
Party | Candidate | Votes | % | ±% | |
---|---|---|---|---|---|
Liberal | Fred Grimwade | 47,916 | 55.0 | +5.7 | |
Labor | Max McDonald | 39,138 | 45.0 | +8.7 | |
Total formal votes | 87,054 | 97.1 | −0.3 | ||
Informal votes | 2,039 | 2.5 | +0.3 | ||
Turnout | 89,666 | 92.5 | +0.4 | ||
Liberal hold | Swing | -5.7 | |||
Party | Candidate | Votes | % | ±% | |
---|---|---|---|---|---|
Labor | Eric Kent | 59,381 | 51.2 | +2.4 | |
Liberal | Geoffrey Connard | 55,684 | 48.8 | −2.4 | |
Total formal votes | 115,065 | 96.3 | −0.5 | ||
Informal votes | 4,369 | 3.7 | +0.5 | ||
Turnout | 119,434 | 93.8 | +1.3 | ||
Labor gain from Liberal | Swing | +2.4 | |||
Party | Candidate | Votes | % | ±% | |
---|---|---|---|---|---|
Labor | David White | 69,342 | 58.5 | +4.9 | |
Liberal | Claus Salger | 49,192 | 41.5 | −4.9 | |
Total formal votes | 118,534 | 95.0 | +0.7 | ||
Informal votes | 6,246 | 5.0 | −0.7 | ||
Turnout | 124,780 | 94.3 | +0.5 | ||
Labor hold | Swing | +4.9 | |||
Party | Candidate | Votes | % | ±% | |
---|---|---|---|---|---|
Liberal | Bill Campbell | 56,302 | 56.3 | −8.5 | |
Labor | Jeanne Hendy | 32,679 | 32.7 | −2.5 | |
Democrats | Michael McBride | 11,075 | 11.1 | +11.1 | |
Total formal votes | 100,056 | 97.6 | −0.1 | ||
Informal votes | 2,483 | 2.4 | +0.1 | ||
Turnout | 102,539 | 91.5 | −0.3 | ||
Liberal hold | Swing | N/A | |||
Party | Candidate | Votes | % | ±% | |
---|---|---|---|---|---|
Labor | Rod Mackenzie | 40,564 | 49.0 | +1.5 | |
Liberal | Gordon Hall | 39,047 | 47.2 | −5.3 | |
Democratic Labor | James Jordan | 3,212 | 3.9 | +3.9 | |
Total formal votes | 82,823 | 97.0 | +0.1 | ||
Informal votes | 2,586 | 3.0 | −0.1 | ||
Turnout | 85,409 | 94.2 | −1.5 | ||
Two-party-preferred result | |||||
Labor | Rod Mackenzie | 42,133 | 50.9 | +3.4 | |
Liberal | Gordon Hall | 40,690 | 49.1 | −3.4 | |
Labor gain from Liberal | Swing | +3.4 | |||
Party | Candidate | Votes | % | ±% | |
---|---|---|---|---|---|
Labor | Thomas Matthews | 30,624 | 40.2 | +2.0 | |
Liberal | Dick Long | 24,874 | 32.7 | +3.1 | |
National | John King | 12,678 | 16.7 | −8.8 | |
Democrats | Ian Goldie | 6,232 | 8.2 | +8.2 | |
Independent | Bruce Ingle | 1,718 | 2.3 | +2.3 | |
Total formal votes | 76,126 | 95.9 | −1.9 | ||
Informal votes | 3,280 | 4.1 | +1.9 | ||
Turnout | 79,406 | 93.5 | +0.2 | ||
Two-party-preferred result | |||||
Liberal | Dick Long | 41,788 | 54.9 | −2.5 | |
Labor | Thomas Matthews | 34,338 | 45.1 | +2.5 | |
Liberal hold | Swing | -2.5 | |||
Party | Candidate | Votes | % | ±% | |
---|---|---|---|---|---|
Liberal | Robert Lawson | 55,703 | 54.7 | −7.3 | |
Labor | Geoffrey Fleming | 46,031 | 45.3 | +7.3 | |
Total formal votes | 101,734 | 97.2 | −0.4 | ||
Informal votes | 2,961 | 2.8 | +0.4 | ||
Turnout | 104,695 | 93.4 | +0.5 | ||
Liberal hold | Swing | -7.3 | |||
Party | Candidate | Votes | % | ±% | |
---|---|---|---|---|---|
Labor | Evan Walker | 56,565 | 62.5 | +4.7 | |
Liberal | Bill Stanley | 33,917 | 37.5 | −4.7 | |
Total formal votes | 90,482 | 94.8 | −0.4 | ||
Informal votes | 4,946 | 5.2 | +0.4 | ||
Turnout | 95,428 | 87.4 | +1.6 | ||
Labor hold | Swing | +4.7 | |||
Party | Candidate | Votes | % | ±% | |
---|---|---|---|---|---|
Labor | Giovanni Sgro | 52,787 | 53.1 | −10.5 | |
Liberal | Geoff Lutz | 26,222 | 26.4 | −11.1 | |
Independent | Eric Granger | 20,496 | 20.6 | +20.6 | |
Total formal votes | 99,955 | 94.7 | −0.4 | ||
Informal votes | 5,555 | 5.3 | +0.4 | ||
Turnout | 105,060 | 91.2 | −0.4 | ||
Labor hold | Swing | N/A | |||
Party | Candidate | Votes | % | ±% | |
---|---|---|---|---|---|
Labor | Joan Coxsedge | 54,263 | 52.8 | −7.1 | |
Liberal | Rino Baggio | 29,842 | 29.0 | −11.2 | |
Independent | Alexander Knight | 13,202 | 12.9 | +12.9 | |
Democrats | Ivan Pollock | 5,466 | 5.3 | +5.3 | |
Total formal votes | 102,773 | 94.7 | −0.2 | ||
Informal votes | 5,716 | 5.3 | +0.2 | ||
Turnout | 108,489 | 93.6 | +1.4 | ||
Labor hold | Swing | N/A | |||
Party | Candidate | Votes | % | ±% | |
---|---|---|---|---|---|
Liberal | Don Hayward | 57,361 | 59.6 | −5.1 | |
Labor | Howard Smith | 38,798 | 40.4 | +5.1 | |
Total formal votes | 96,159 | 96.9 | 0.0 | ||
Informal votes | 3,112 | 3.1 | 0.0 | ||
Turnout | 99,271 | 90.6 | +0.7 | ||
Liberal hold | Swing | -5.1 | |||
Party | Candidate | Votes | % | ±% | |
---|---|---|---|---|---|
National | Bill Baxter | 33,686 | 40.8 | −12.7 | |
Liberal | Bill Hunter | 24,157 | 29.3 | +6.8 | |
Labor | Nicholas Paola | 20,090 | 24.3 | +0.3 | |
Democrats | Diane Teasdale | 4,594 | 5.6 | +5.6 | |
Total formal votes | 82,527 | 96.2 | −1.1 | ||
Informal votes | 3,218 | 3.8 | +1.1 | ||
Turnout | 85,745 | 94.5 | +0.1 | ||
Two-candidate-preferred result | |||||
National | Bill Baxter | 53,334 | 64.6 | ||
Liberal | Bill Hunter | 29,193 | 35.4 | ||
National hold | Swing | ||||
Party | Candidate | Votes | % | ±% | |
---|---|---|---|---|---|
National | Ken Wright | 34,310 | 45.7 | −5.5 | |
Liberal | Ian Milburn | 22,768 | 30.3 | +0.4 | |
Labor | Pamela Fowler | 18,019 | 24.0 | +5.1 | |
Total formal votes | 75,097 | 97.2 | −0.5 | ||
Informal votes | 2,193 | 2.8 | +0.5 | ||
Turnout | 77,290 | 95.2 | +0.9 | ||
Two-candidate-preferred result | |||||
National | Ken Wright | 47,267 | 62.9 | −3.4 | |
Liberal | Ian Milburn | 27,830 | 37.1 | +3.4 | |
National hold | Swing | -3.4 | |||
Party | Candidate | Votes | % | ±% | |
---|---|---|---|---|---|
Liberal | Peter Block | 55,983 | 49.8 | −10.4 | |
Labor | Alan Wearne | 43,709 | 38.9 | −0.9 | |
Democrats | Jeffrey McAlpine | 12,644 | 11.3 | +11.3 | |
Total formal votes | 112,336 | 97.6 | 0.0 | ||
Informal votes | 2,706 | 2.4 | 0.0 | ||
Turnout | 115,042 | 94.0 | +0.4 | ||
Two-party-preferred result | |||||
Liberal | Peter Block | 62,697 | 55.8 | −4.4 | |
Labor | Alan Wearne | 49,639 | 44.2 | +4.4 | |
Liberal hold | Swing | -4.4 | |||
Party | Candidate | Votes | % | ±% | |
---|---|---|---|---|---|
Liberal | Alan Hunt | 40,278 | 46.1 | +0.5 | |
Labor | Norman Spencer | 29,065 | 33.3 | +4.3 | |
National | Donald McRae | 13,110 | 15.0 | −4.6 | |
Democrats | Stefan Taficsuk | 4,790 | 5.5 | +5.5 | |
Total formal votes | 87,243 | 97.5 | −0.5 | ||
Informal votes | 2,275 | 2.5 | +0.5 | ||
Turnout | 89,518 | 92.8 | +0.2 | ||
Two-party-preferred result | |||||
Liberal | Alan Hunt | 53,662 | 61.5 | −4.9 | |
Labor | Norman Spencer | 33,581 | 38.5 | +4.9 | |
Liberal hold | Swing | -4.9 | |||
Party | Candidate | Votes | % | ±% | |
---|---|---|---|---|---|
Liberal | Vasey Houghton | 56,059 | 50.5 | −7.3 | |
Labor | Mike Arnold | 54,881 | 49.5 | +7.3 | |
Total formal votes | 110,940 | 97.4 | −0.2 | ||
Informal votes | 2,934 | 2.6 | +0.2 | ||
Turnout | 113,874 | 93.5 | +0.5 | ||
Liberal hold | Swing | -7.3 | |||
Party | Candidate | Votes | % | ±% | |
---|---|---|---|---|---|
Labor | Glyde Butler | 75,172 | 68.4 | +7.2 | |
Liberal | Kathleen Mulraney | 34,678 | 31.6 | −7.2 | |
Total formal votes | 109,850 | 94.5 | −1.0 | ||
Informal votes | 6,395 | 5.5 | +1.0 | ||
Turnout | 116,245 | 93.8 | +0.5 | ||
Labor hold | Swing | +7.2 | |||
Party | Candidate | Votes | % | ±% | |
---|---|---|---|---|---|
Labor | Cyril Kennedy | 49,097 | 44.8 | +2.0 | |
Liberal | William McDonald | 48,309 | 44.1 | −13.1 | |
Democrats | Frederick Steinicke | 8,813 | 8.1 | +8.1 | |
Independent | Stephen Buttery | 3,284 | 3.0 | +3.0 | |
Total formal votes | 109,503 | 95.9 | −0.6 | ||
Informal votes | 4,675 | 4.1 | +0.6 | ||
Turnout | 114,178 | 93.5 | +0.2 | ||
Two-party-preferred result | |||||
Labor | Cyril Kennedy | 55,376 | 50.6 | +6.3 | |
Liberal | William McDonald | 54,127 | 49.4 | −6.3 | |
Labor gain from Liberal | Swing | +6.3 | |||
Party | Candidate | Votes | % | ±% | |
---|---|---|---|---|---|
Liberal | Digby Crozier | 39,262 | 50.8 | +3.4 | |
Labor | Henry Birrell | 25,969 | 33.6 | +4.0 | |
National | Clive Mitchell | 12,126 | 15.7 | −7.3 | |
Total formal votes | 77,357 | 97.9 | −0.5 | ||
Informal votes | 1,640 | 2.1 | +0.5 | ||
Turnout | 78,997 | 95.2 | 0.0 | ||
Liberal hold | Swing | N/A | |||
The Shooters, Fishers and Farmers Party (SFF) is a conservative Australian political party. It primarily advocates for increased funding and services for rural and regional Australia, protecting the right to farm, enhancing commercial and recreational fishing, tougher sentencing for illegal firearm trade and usage, and relaxing gun control for law abiding citizens.
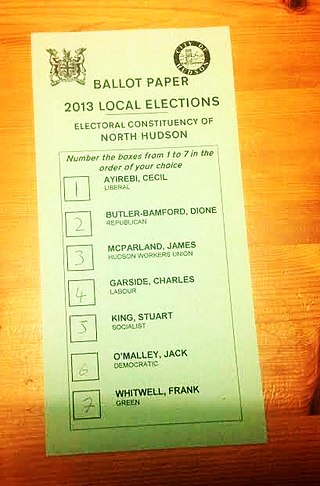
In electoral systems which use ranked voting, a donkey vote is a cast ballot where the voter ranks the candidates based on the order they appear on the ballot itself. The voter that votes in this manner is referred to as a donkey voter.
A group voting ticket (GVT) is a shortcut for voters in a preferential voting system, where a voter can indicate support for a list of candidates instead of marking preferences for individual candidates. For multi-member electoral divisions with single transferable voting, a group or party registers a GVT before an election with the electoral commission. When a voter selects a group or party above the line on a ballot paper, their vote is distributed according to the registered GVT for that group.
The 2006 Victorian state election, held on Saturday, 25 November 2006, was for the 56th Parliament of Victoria. Just over 3 million Victorians registered to vote elected 88 members to the Legislative Assembly and, for the first time, 40 members to the Legislative Council under a proportional representation system. The election was conducted by the independent Victorian Electoral Commission.
The Voluntary Euthanasia Party (VEP) was a minor political party in Australia, founded in early 2013 by Corey McCann to advocate for legislative change to allow voluntary euthanasia in Australia. The party's inception was strongly supported by Dr Philip Nitschke, director of Exit International and Richard Mills, then President of Dying with Dignity NSW.
Elections were held in the Australian state of Victoria on Saturday 18 June 1955 to elect 17 of the 34 members of the state's Legislative Council for six year terms. MLCs were elected in single-member provinces using preferential voting.
This is a list of Legislative Council results for the Victorian 1967 state election. 18 of the 35 seats were contested.
The Nunawading Province by-election of 1985 was a by-election in the Nunawading Province for the Victorian Legislative Council held on 17 August 1985. It was ordered by the Court of Disputed Returns after the 1985 Victorian state election had resulted in a dead heat between the top two candidates, and the Chief Electoral Officer drew a name at random. The Chief Electoral Officer drew the name of the ALP candidate Bob Ives. After the Court ordered a new election, the outcome was that the Liberal candidate Rosemary Varty was returned.
This is a list of Legislative Council results for the Victorian 1964 state election. 17 of the 34 seats were contested.
This is a list of electoral district results for the Victorian 1943 election.
This is a list of electoral results for the Melbourne North Province in Victorian state elections.
This is a list of electoral results for the Melbourne West Province in Victorian state elections.
This is a list of electoral results for the East Yarra Province in Victorian state elections.
This is a list of electoral results for the Doutta Galla Province in Victorian state elections.
This is a list of electoral results for the Higinbotham Province in Victorian state elections.
This is a list of electoral results for the North Eastern Province in Victorian state elections.
This is a list of electoral results for the Northern Province in Victorian state elections.
This is a list of electoral results for the Gippsland Province in Victorian state elections.
This is a list of electoral results for the Western Province in Victorian state elections.
The 2026 Victorian state election is expected to be held on 28 November 2026 to elect the 61st Parliament of Victoria. All 88 seats in the Legislative Assembly and all 40 seats in the Legislative Council will be up for election, presuming there are no new electorates added in a redistribution.