Financial economics is the branch of economics characterized by a "concentration on monetary activities", in which "money of one type or another is likely to appear on both sides of a trade". Its concern is thus the interrelation of financial variables, such as share prices, interest rates and exchange rates, as opposed to those concerning the real economy. It has two main areas of focus: asset pricing and corporate finance; the first being the perspective of providers of capital, i.e. investors, and the second of users of capital. It thus provides the theoretical underpinning for much of finance.
In finance, the capital asset pricing model (CAPM) is a model used to determine a theoretically appropriate required rate of return of an asset, to make decisions about adding assets to a well-diversified portfolio.
Modern portfolio theory (MPT), or mean-variance analysis, is a mathematical framework for assembling a portfolio of assets such that the expected return is maximized for a given level of risk. It is a formalization and extension of diversification in investing, the idea that owning different kinds of financial assets is less risky than owning only one type. Its key insight is that an asset's risk and return should not be assessed by itself, but by how it contributes to a portfolio's overall risk and return. The variance of return is used as a measure of risk, because it is tractable when assets are combined into portfolios. Often, the historical variance and covariance of returns is used as a proxy for the forward-looking versions of these quantities, but other, more sophisticated methods are available.
In finance, arbitrage pricing theory (APT) is a multi-factor model for asset pricing which relates various macro-economic (systematic) risk variables to the pricing of financial assets. Proposed by economist Stephen Ross in 1976, it is widely believed to be an improved alternative to its predecessor, the capital asset pricing model (CAPM). APT is founded upon the law of one price, which suggests that within an equilibrium market, rational investors will implement arbitrage such that the equilibrium price is eventually realised. As such, APT argues that when opportunities for arbitrage are exhausted in a given period, then the expected return of an asset is a linear function of various factors or theoretical market indices, where sensitivities of each factor is represented by a factor-specific beta coefficient or factor loading. Consequently, it provides traders with an indication of ‘true’ asset value and enables exploitation of market discrepancies via arbitrage. The linear factor model structure of the APT is used as the basis for evaluating asset allocation, the performance of managed funds as well as the calculation of cost of capital. Furthermore, the newer APT model is more dynamic being utilised in more theoretical application than the preceding CAPM model. A 1986 article written by Gregory Connor and Robert Korajczyk, utilised the APT framework and applied it to portfolio performance measurement suggesting that the Jensen coefficient is an acceptable measurement of portfolio performance.
In finance, the beta is a statistic that measures the expected increase or decrease of an individual stock price in proportion to movements of the stock market as a whole. Beta can be used to indicate the contribution of an individual asset to the market risk of a portfolio when it is added in small quantity. It refers to an asset's non-diversifiable risk, systematic risk, or market risk. Beta is not a measure of idiosyncratic risk.
In finance, Jensen's alpha is used to determine the abnormal return of a security or portfolio of securities over the theoretical expected return. It is a version of the standard alpha based on a theoretical performance instead of a market index.
Market portfolio is a portfolio consisting of a weighted sum of every asset in the market, with weights in the proportions that they exist in the market, with the necessary assumption that these assets are infinitely divisible.
Alpha is a measure of the active return on an investment, the performance of that investment compared with a suitable market index. An alpha of 1% means the investment's return on investment over a selected period of time was 1% better than the market during that same period; a negative alpha means the investment underperformed the market. Alpha, along with beta, is one of two key coefficients in the capital asset pricing model used in modern portfolio theory and is closely related to other important quantities such as standard deviation, R-squared and the Sharpe ratio.
A market anomaly in a financial market is predictability that seems to be inconsistent with theories of asset prices. Standard theories include the capital asset pricing model and the Fama-French Three Factor Model, but a lack of agreement among academics about the proper theory leads many to refer to anomalies without a reference to a benchmark theory. Indeed, many academics simply refer to anomalies as "return predictors", avoiding the problem of defining a benchmark theory.
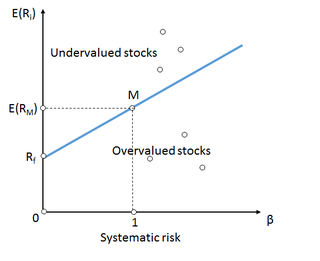
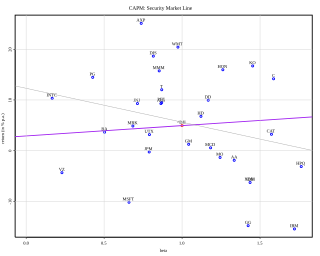
Security market line (SML) is the representation of the capital asset pricing model. It displays the expected rate of return of an individual security as a function of systematic, non-diversifiable risk. The risk of an individual risky security reflects the volatility of the return from the security rather than the return of the market portfolio. The risk in these individual risky securities reflects the systematic risk.
The single-index model (SIM) is a simple asset pricing model to measure both the risk and the return of a stock. The model has been developed by William Sharpe in 1963 and is commonly used in the finance industry. Mathematically the SIM is expressed as:
The consumption-based capital asset pricing model (CCAPM) is a model of the determination of expected return on an investment. The foundations of this concept were laid by the research of Robert Lucas (1978) and Douglas Breeden (1979).
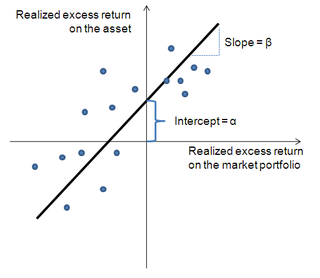
Security characteristic line (SCL) is a regression line, plotting performance of a particular security or portfolio against that of the market portfolio at every point in time. The SCL is plotted on a graph where the Y-axis is the excess return on a security over the risk-free return and the X-axis is the excess return of the market in general. The slope of the SCL is the security's beta, and the intercept is its alpha.
In portfolio theory, a mutual fund separation theorem, mutual fund theorem, or separation theorem is a theorem stating that, under certain conditions, any investor's optimal portfolio can be constructed by holding each of certain mutual funds in appropriate ratios, where the number of mutual funds is smaller than the number of individual assets in the portfolio. Here a mutual fund refers to any specified benchmark portfolio of the available assets. There are two advantages of having a mutual fund theorem. First, if the relevant conditions are met, it may be easier for an investor to purchase a smaller number of mutual funds than to purchase a larger number of assets individually. Second, from a theoretical and empirical standpoint, if it can be assumed that the relevant conditions are indeed satisfied, then implications for the functioning of asset markets can be derived and tested.
Downside risk is the financial risk associated with losses. That is, it is the risk of the actual return being below the expected return, or the uncertainty about the magnitude of that difference.
Returns-based style analysis (RBSA) is a statistical technique used in finance to deconstruct the returns of investment strategies using a variety of explanatory variables. The model results in a strategy's exposures to asset classes or other factors, interpreted as a measure of a fund or portfolio manager's investment style. While the model is most frequently used to show an equity mutual fund’s style with reference to common style axes, recent applications have extended the model’s utility to model more complex strategies, such as those employed by hedge funds.
In investing, downside beta is the beta that measures a stock's association with the overall stock market (risk) only on days when the market’s return is negative. Downside beta was first proposed by Roy 1952 and then popularized in an investment book by Markowitz (1959).
In investing, upside beta is the element of traditional beta that investors do not typically associate with the true meaning of risk. It is defined to be the scaled amount by which an asset tends to move compared to a benchmark, calculated only on days when the benchmark's return is positive.
The joint hypothesis problem is the problem that testing for market efficiency is difficult, or even impossible. Any attempts to test for market (in)efficiency must involve asset pricing models so that there are expected returns to compare to real returns. It is not possible to measure 'abnormal' returns without expected returns predicted by pricing models. Therefore, anomalous market returns may reflect market inefficiency, an inaccurate asset pricing model or both.
Untradable assets are assets that are not traded on the market. Human capital is the most important nontraded assets. Other important nontraded asset classes are private businesses, claims to government transfer payments and claims on trust income.


