
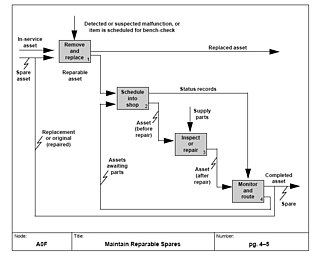
A routing diagram or route diagram in the field of management engineering is a type of diagram, that shows a route through an accessible physical space. [1] Routing diagrams are used in plant layout study, and manufacturing plant design.
A routing diagram or route diagram in the field of management engineering is a type of diagram, that shows a route through an accessible physical space. [1] Routing diagrams are used in plant layout study, and manufacturing plant design.
A routing diagrams shows a route through a physical space. They are often considered a type of flow diagram, but they differ from flowcharts, that a routing is pictured in a physical layout. There is a similarity with design of Electrical equipment, where routing diagrams also in show "the physical layout of the facility and equipment and how the circuit how the circuit to the various equipment is run." [2]
A picture with a routing in geographical space is often called a route map. While the road map and transit map (such as the railway map, metro map, bus map, etc.) show all the roads or lines, the route map regularly shows one rad for a particular occasion. Likewise a ground plan or site map show all the space, buildings and/or rooms, the routing map shows one specific route on site.
Routing diagrams are used in plant layout study. The routing diagram can consist of a floor plan with a trace attached, or a 3d cross section of a building with a trace. The routing diagram transforms into a flow diagram when the physical dimensions are taken out of the equation. [3]
A schematic, or schematic diagram, is a representation of the elements of a system using abstract, graphic symbols rather than realistic pictures. A schematic usually omits all details that are not relevant to the key information the schematic is intended to convey, and may include oversimplified elements in order to make this essential meaning easier to grasp.
Instrumentation is a collective term for measuring instruments that are used for indicating, measuring and recording physical quantities. The term has its origins in the art and science of scientific instrument-making.

A chart is a graphical representation for data visualization, in which "the data is represented by symbols, such as bars in a bar chart, lines in a line chart, or slices in a pie chart". A chart can represent tabular numeric data, functions or some kinds of quality structure and provides different info.

A substation is a part of an electrical generation, transmission, and distribution system. Substations transform voltage from high to low, or the reverse, or perform any of several other important functions. Between the generating station and consumer, electric power may flow through several substations at different voltage levels. A substation may include transformers to change voltage levels between high transmission voltages and lower distribution voltages, or at the interconnection of two different transmission voltages.

A circuit diagram is a graphical representation of an electrical circuit. A pictorial circuit diagram uses simple images of components, while a schematic diagram shows the components and interconnections of the circuit using standardized symbolic representations. The presentation of the interconnections between circuit components in the schematic diagram does not necessarily correspond to the physical arrangements in the finished device.
An industrial process control in continuous production processes is a discipline that uses industrial control systems to achieve a production level of consistency, economy and safety which could not be achieved purely by human manual control. It is implemented widely in industries such as automotive, mining, dredging, oil refining, pulp and paper manufacturing, chemical processing and power generating plants.

In power engineering, a single-line diagram (SLD), also sometimes called one-line diagram, is a simplest symbolic representation of an electric power system. A single line in the diagram typically corresponds to more than one physical conductor: in a direct current system the line includes the supply and return paths, in a three-phase system the line represents all three phases.

Infographics are graphic visual representations of information, data, or knowledge intended to present information quickly and clearly. They can improve cognition by utilizing graphics to enhance the human visual system's ability to see patterns and trends. Similar pursuits are information visualization, data visualization, statistical graphics, information design, or information architecture. Infographics have evolved in recent years to be for mass communication, and thus are designed with fewer assumptions about the readers' knowledge base than other types of visualizations. Isotypes are an early example of infographics conveying information quickly and easily to the masses.

A block diagram is a diagram of a system in which the principal parts or functions are represented by blocks connected by lines that show the relationships of the blocks. They are heavily used in engineering in hardware design, electronic design, software design, and process flow diagrams.

An organizational chart, also called organigram,organogram, or organizational breakdown structure (OBS) is a diagram that shows the structure of an organization and the relationships and relative ranks of its parts and positions/jobs. The term is also used for similar diagrams, for example ones showing the different elements of a field of knowledge or a group of languages.

Flow diagram is a collective term for a diagram representing a flow or set of dynamic relationships in a system. The term flow diagram is also used as a synonym for flowchart, and sometimes as a counterpart of the flowchart.

A chemical plant is an industrial process plant that manufactures chemicals, usually on a large scale. The general objective of a chemical plant is to create new material wealth via the chemical or biological transformation and or separation of materials. Chemical plants use specialized equipment, units, and technology in the manufacturing process. Other kinds of plants, such as polymer, pharmaceutical, food, and some beverage production facilities, power plants, oil refineries or other refineries, natural gas processing and biochemical plants, water and wastewater treatment, and pollution control equipment use many technologies that have similarities to chemical plant technology such as fluid systems and chemical reactor systems. Some would consider an oil refinery or a pharmaceutical or polymer manufacturer to be effectively a chemical plant.
In chemical engineering, process design is the choice and sequencing of units for desired physical and/or chemical transformation of materials. Process design is central to chemical engineering, and it can be considered to be the summit of that field, bringing together all of the field's components.
In a scientific sense, a chemical process is a method or means of somehow changing one or more chemicals or chemical compounds. Such a chemical process can occur by itself or be caused by an outside force, and involves a chemical reaction of some sort. In an "engineering" sense, a chemical process is a method intended to be used in manufacturing or on an industrial scale to change the composition of chemical(s) or material(s), usually using technology similar or related to that used in chemical plants or the chemical industry.

A drafter is an engineering technician who makes detailed technical drawings or plans for machinery, buildings, electronics, infrastructure, sections, etc. Drafters use computer software and manual sketches to convert the designs, plans, and layouts of engineers and architects into a set of technical drawings. Drafters operate as the supporting developers and sketch engineering designs and drawings from preliminary design concepts.
In systems engineering, software engineering, and computer science, a function model or functional model is a structured representation of the functions within the modeled system or subject area.

Electronic engineering is a sub-discipline of electrical engineering which emerged in the early 20th century and is distinguished by the additional use of active components such as semiconductor devices to amplify and control electric current flow. Previously electrical engineering only used passive devices such as mechanical switches, resistors, inductors and capacitors.
Willard Cope Brinton was an American consulting engineer, president of Brinton Associates, and information visualisation pioneer, particularly known for publication of the 1914 textbook on graphic methods, entitled Graphic methods for presenting facts.
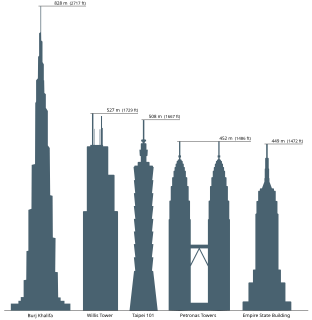
Comparison diagram or comparative diagram is a general type of diagram, in which a comparison is made between two or more objects, phenomena or groups of data. A comparison diagram or can offer qualitative and/or quantitative information. This type of diagram can also be called comparison chart or comparison chart. The diagram itself is sometimes referred to as a cluster diagram.

Charles Day was an American electrical, construction and consulting engineer, and co-founder of Day & Zimmermann. He is known as a specialist in public utility management and operation, and for his seminal contributions to flow charts and the routing diagram.