In mathematics and statistics, the arithmetic mean, arithmetic average, or just the mean or average is the sum of a collection of numbers divided by the count of numbers in the collection. The collection is often a set of results from an experiment, an observational study, or a survey. The term "arithmetic mean" is preferred in some mathematics and statistics contexts because it helps distinguish it from other types of means, such as geometric and harmonic.
In mathematics, a combination is a selection of items from a set that has distinct members, such that the order of selection does not matter. For example, given three fruits, say an apple, an orange and a pear, there are three combinations of two that can be drawn from this set: an apple and a pear; an apple and an orange; or a pear and an orange. More formally, a k-combination of a set S is a subset of k distinct elements of S. So, two combinations are identical if and only if each combination has the same members. If the set has n elements, the number of k-combinations, denoted by or , is equal to the binomial coefficient

In probability theory, the sample space of an experiment or random trial is the set of all possible outcomes or results of that experiment. A sample space is usually denoted using set notation, and the possible ordered outcomes, or sample points, are listed as elements in the set. It is common to refer to a sample space by the labels S, Ω, or U. The elements of a sample space may be numbers, words, letters, or symbols. They can also be finite, countably infinite, or uncountably infinite.
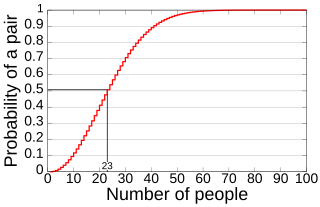
In probability theory, the birthday problem asks for the probability that, in a set of n randomly chosen people, at least two will share a birthday. The birthday paradox refers to the counterintuitive fact that only 23 people are needed for that probability to exceed 50%.
A mathematical symbol is a figure or a combination of figures that is used to represent a mathematical object, an action on mathematical objects, a relation between mathematical objects, or for structuring the other symbols that occur in a formula. As formulas are entirely constituted with symbols of various types, many symbols are needed for expressing all mathematics.
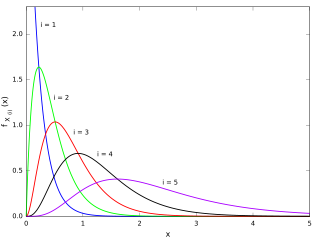
In statistics, the kth order statistic of a statistical sample is equal to its kth-smallest value. Together with rank statistics, order statistics are among the most fundamental tools in non-parametric statistics and inference.
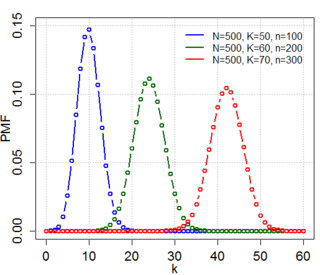
In probability theory and statistics, the hypergeometric distribution is a discrete probability distribution that describes the probability of successes in draws, without replacement, from a finite population of size that contains exactly objects with that feature, wherein each draw is either a success or a failure. In contrast, the binomial distribution describes the probability of successes in draws with replacement.

In combinatorics, a branch of mathematics, the inclusion–exclusion principle is a counting technique which generalizes the familiar method of obtaining the number of elements in the union of two finite sets; symbolically expressed as
In statistics, an effect size is a value measuring the strength of the relationship between two variables in a population, or a sample-based estimate of that quantity. It can refer to the value of a statistic calculated from a sample of data, the value of a parameter for a hypothetical population, or to the equation that operationalizes how statistics or parameters lead to the effect size value. Examples of effect sizes include the correlation between two variables, the regression coefficient in a regression, the mean difference, or the risk of a particular event happening. Effect sizes complement statistical hypothesis testing, and play an important role in power analyses, sample size planning, and in meta-analyses. The cluster of data-analysis methods concerning effect sizes is referred to as estimation statistics.
In probability theory, the factorial moment is a mathematical quantity defined as the expectation or average of the falling factorial of a random variable. Factorial moments are useful for studying non-negative integer-valued random variables, and arise in the use of probability-generating functions to derive the moments of discrete random variables.
In statistics, the binomial test is an exact test of the statistical significance of deviations from a theoretically expected distribution of observations into two categories using sample data.
An index of qualitative variation (IQV) is a measure of statistical dispersion in nominal distributions. Examples include the variation ratio or the information entropy.
In survey methodology, Poisson sampling is a sampling process where each element of the population is subjected to an independent Bernoulli trial which determines whether the element becomes part of the sample.
In the theory of finite population sampling, Bernoulli sampling is a sampling process where each element of the population is subjected to an independent Bernoulli trial which determines whether the element becomes part of the sample. An essential property of Bernoulli sampling is that all elements of the population have equal probability of being included in the sample.
Gy's sampling theory is a theory about the sampling of materials, developed by Pierre Gy from the 1950s to beginning 2000s in articles and books including:
In statistical theory, a U-statistic is a class of statistics defined as the average over the application of a given function applied to all tuples of a fixed size. The letter "U" stands for unbiased. In elementary statistics, U-statistics arise naturally in producing minimum-variance unbiased estimators.
In statistics, L-moments are a sequence of statistics used to summarize the shape of a probability distribution. They are linear combinations of order statistics (L-statistics) analogous to conventional moments, and can be used to calculate quantities analogous to standard deviation, skewness and kurtosis, termed the L-scale, L-skewness and L-kurtosis respectively. Standardised L-moments are called L-moment ratios and are analogous to standardized moments. Just as for conventional moments, a theoretical distribution has a set of population L-moments. Sample L-moments can be defined for a sample from the population, and can be used as estimators of the population L-moments.
In survey research, the design effect is a number that shows how well a sample of people may represent a larger group of people for a specific measure of interest. This is important when the sample comes from a sampling method that is different than just picking people using a simple random sample.
In statistics, the Horvitz–Thompson estimator, named after Daniel G. Horvitz and Donovan J. Thompson, is a method for estimating the total and mean of a pseudo-population in a stratified sample by applying inverse probability weighting to account for the difference in the sampling distribution between the collected data and the a target population. The Horvitz–Thompson estimator is frequently applied in survey analyses and can be used to account for missing data, as well as many sources of unequal selection probabilities.
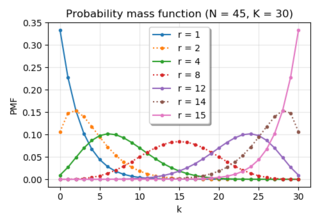
In probability theory and statistics, the negative hypergeometric distribution describes probabilities for when sampling from a finite population without replacement in which each sample can be classified into two mutually exclusive categories like Pass/Fail or Employed/Unemployed. As random selections are made from the population, each subsequent draw decreases the population causing the probability of success to change with each draw. Unlike the standard hypergeometric distribution, which describes the number of successes in a fixed sample size, in the negative hypergeometric distribution, samples are drawn until failures have been found, and the distribution describes the probability of finding successes in such a sample. In other words, the negative hypergeometric distribution describes the likelihood of successes in a sample with exactly failures.


