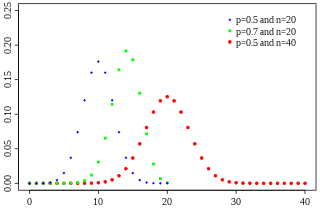
In probability theory and statistics, the binomial distribution with parameters n and p is the discrete probability distribution of the number of successes in a sequence of n independent experiments, each asking a yes–no question, and each with its own boolean-valued outcome: a random variable containing a single bit of information: success/yes/true/one or failure/no/false/zero. A single success/failure experiment is also called a Bernoulli trial or Bernoulli experiment and a sequence of outcomes is called a Bernoulli process; for a single trial, i.e., n = 1, the binomial distribution is a Bernoulli distribution. The binomial distribution is the basis for the popular binomial test of statistical significance.

Cluster sampling is a sampling plan used when mutually homogeneous yet internally heterogeneous groupings are evident in a statistical population. It is often used in marketing research. In this sampling plan, the total population is divided into these groups and a simple random sample of the groups is selected. The elements in each cluster are then sampled. If all elements in each sampled cluster are sampled, then this is referred to as a "one-stage" cluster sampling plan. If a simple random subsample of elements is selected within each of these groups, this is referred to as a "two-stage" cluster sampling plan. A common motivation for cluster sampling is to reduce the total number of interviews and costs given the desired accuracy. For a fixed sample size, the expected random error is smaller when most of the variation in the population is present internally within the groups, and not between the groups.

Frequentist probability or frequentism is an interpretation of probability; it defines an event's probability as the limit of its relative frequency in a large number of trials. This interpretation supports the statistical needs of experimental scientists and pollsters; probabilities can be found by a repeatable objective process. It does not support all needs; gamblers typically require estimates of the odds without experiments.
In probability theory, the sample space of an experiment or random trial is the set of all possible outcomes or results of that experiment. A sample space is usually denoted using set notation, and the possible ordered outcomes are listed as elements in the set. It is common to refer to a sample space by the labels S, Ω, or U.
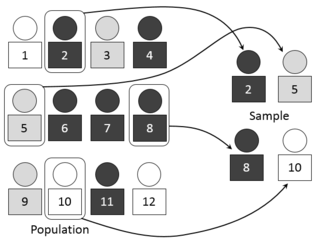
In statistics, survey sampling describes the process of selecting a sample of elements from a target population to conduct a survey. The term "survey" may refer to many different types or techniques of observation. In survey sampling it most often involves a questionnaire used to measure the characteristics and/or attitudes of people. Different ways of contacting members of a sample once they have been selected is the subject of survey data collection. The purpose of sampling is to reduce the cost and/or the amount of work that it would take to survey the entire target population. A survey that measures the entire target population is called a census. A sample refers to a group or section of a population from which information is to be obtained

In statistics, the standard deviation is a measure that is used to quantify the amount of variation or dispersion of a set of data values. A low standard deviation indicates that the data points tend to be close to the mean of the set, while a high standard deviation indicates that the data points are spread out over a wider range of values.
In probability theory, a probability space or a probability triple is a mathematical construct that models a real-world process consisting of states that occur randomly. A probability space is constructed with a specific kind of situation or experiment in mind. One proposes that each time a situation of that kind arises, the set of possible outcomes is the same and the probabilities are also the same.

In the theory of probability and statistics, a Bernoulli trial is a random experiment with exactly two possible outcomes, "success" and "failure", in which the probability of success is the same every time the experiment is conducted. It is named after Jacob Bernoulli, a 17th-century Swiss mathematician, who analyzed them in his Ars Conjectandi (1713).

In statistics, an outlier is an observation point that is distant from other observations. An outlier may be due to variability in the measurement or it may indicate experimental error; the latter are sometimes excluded from the data set. An outlier can cause serious problems in statistical analyses.
In probability theory and statistics, the Bernoulli distribution, named after Swiss mathematician Jacob Bernoulli, is the discrete probability distribution of a random variable which takes the value 1 with probability and the value 0 with probability that is, the probability distribution of any single experiment that asks a yes–no question; the question results in a boolean-valued outcome, a single bit of information whose value is success/yes/true/one with probability p and failure/no/false/zero with probability q. It can be used to represent a coin toss where 1 and 0 would represent "heads" and "tails", respectively, and p would be the probability of the coin landing on heads or tails, respectively. In particular, unfair coins would have
The power of a binary hypothesis test is the probability that the test rejects the null hypothesis (H0) when a specific alternative hypothesis (H1) is true. The statistical power ranges from 0 to 1, and as statistical power increases, the probability of making a type II error (wrongly failing to reject the null) decreases. For a type II error probability of β, the corresponding statistical power is 1 − β. For example, if experiment 1 has a statistical power of 0.7, and experiment 2 has a statistical power of 0.95, then there is a stronger probability that experiment 1 had a type II error than experiment 2, and experiment 2 is more reliable than experiment 1 due to the reduction in probability of a type II error. It can be equivalently thought of as the probability of accepting the alternative hypothesis (H1) when it is true—that is, the ability of a test to detect a specific effect, if that specific effect actually exists. That is,

The margin of error is a statistic expressing the amount of random sampling error in a survey's results. The larger the margin of error, the less confidence one should have that the poll's reported results are close to the "true" figures; that is, the figures for the whole population. Margin of error is positive whenever a population is incompletely sampled and the outcome measure has positive variance.
In chemistry, a mixture is a material made up of two or more different substances which are mixed. A mixture refers to the physical combination of two or more substances in which the identities are retained and are mixed in the form of solutions, suspensions and colloids.
The St. Petersburg paradox or St. Petersburg lottery is a paradox related to probability and decision theory in economics. It is based on a particular (theoretical) lottery game that leads to a random variable with infinite expected value but nevertheless seems to be worth only a very small amount to the participants. The St. Petersburg paradox is a situation where a naive decision criterion which takes only the expected value into account predicts a course of action that presumably no actual person would be willing to take. Several resolutions are possible.
The standard error (SE) of a statistic is the standard deviation of its sampling distribution or an estimate of that standard deviation. If the parameter or the statistic is the mean, it is called the standard error of the mean (SEM).
Sample size determination is the act of choosing the number of observations or replicates to include in a statistical sample. The sample size is an important feature of any empirical study in which the goal is to make inferences about a population from a sample. In practice, the sample size used in a study is determined based on the expense of data collection, and the need to have sufficient statistical power. In complicated studies there may be several different sample sizes involved in the study: for example, in a stratified survey there would be different sample sizes for each stratum. In a census, data are collected on the entire population, hence the sample size is equal to the population size. In experimental design, where a study may be divided into different treatment groups, this may be different sample sizes for each group.
Most of the terms listed in Wikipedia glossaries are already defined and explained within Wikipedia itself. However, glossaries like this one are useful for looking up, comparing and reviewing large numbers of terms together. You can help enhance this page by adding new terms or writing definitions for existing ones.
Good–Turing frequency estimation is a statistical technique for estimating the probability of encountering an object of a hitherto unseen species, given a set of past observations of objects from different species. In drawing balls from an urn, the 'objects' would be balls and the 'species' would be the distinct colors of the balls. After drawing red balls, black balls and green balls, we would ask what is the probability of drawing a red ball, a black ball, a green ball or one of a previously unseen color.
Gy's sampling theory is a theory about the sampling of materials, developed by Pierre Gy from the 1950s to beginning 2000s in articles and books including: