Sequence logo

Last updated
A sequence logo showing the most conserved bases around the initiation codon from all human mRNAs (Kozak consensus sequence). Note that the initiation codon is not drawn to scale, otherwise the letters AUG would each have a height of 2 bits. KozakConsensus.jpg
A sequence logo showing the most conserved bases around the initiation codon from all human mRNAs (Kozak consensus sequence). Note that the initiation codon is not drawn to scale, otherwise the letters AUG would each have a height of 2 bits.

In bioinformatics, a sequence logo is a graphical representation of the sequence conservation of nucleotides (in a strand of DNA/RNA) or amino acids (in protein sequences). [1] A sequence logo is created from a collection of aligned sequences and depicts the consensus sequence and diversity of the sequences. Sequence logos are frequently used to depict sequence characteristics such as protein-binding sites in DNA or functional units in proteins.

Contents

Overview

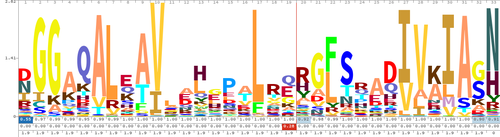
A sequence logo consists of a stack of letters at each position. The relative sizes of the letters indicate their frequency in the sequences. The total height of the letters depicts the information content of the position, in bits.

Logo creation

To create sequence logos, related DNA, RNA or protein sequences, or DNA sequences that have common conserved binding sites, are aligned so that the most conserved parts create good alignments. A sequence logo can then be created from the conserved multiple sequence alignment. The sequence logo will show how well residues are conserved at each position: the higher the number of residues, the higher the letters will be, because the better the conservation is at that position. Different residues at the same position are scaled according to their frequency. The height of the entire stack of residues is the information measured in bits. Sequence logos can be used to represent conserved DNA binding sites, where transcription factors bind.

The information content (y-axis) of position is given by: [2]

for amino acids,
for nucleic acids,

where is the uncertainty (sometimes called the Shannon entropy) of position

Here, is the relative frequency of base or amino acid at position , and is the small-sample correction for an alignment of letters. [2] [3] The height of letter in column is given by

The approximation for the small-sample correction, , is given by:

where is 4 for nucleotides, 20 for amino acids, and is the number of sequences in the alignment.

A consensus logo is a simplified variation of a sequence logo that can be embedded in text format. Like a sequence logo, a consensus logo is created from a collection of aligned protein or DNA/RNA sequences and conveys information about the conservation of each position of a sequence motif or sequence alignment [1] [4] . However, a consensus logo displays only conservation information, and not explicitly the frequency information of each nucleotide or amino acid at each position. Instead of a stack made of several characters, denoting the relative frequency of each character, the consensus logo depicts the degree of conservation of each position using the height of the consensus character at that position.

A sequence logo for the LexA-binding motif of several Gram-positive species. LexA gram positive bacteria sequence logo.png
A sequence logo for the LexA-binding motif of several Gram-positive species.
A consensus logo for the LexA-binding motif of several Gram-positive species. LexA gram positive bacteria consensus logo.png
A consensus logo for the LexA-binding motif of several Gram-positive species.

Advantages and drawbacks

The main, and obvious, advantage of consensus logos over sequence logos is their ability to be embedded as text in any Rich Text Format supporting editor/viewer and, therefore, in scientific manuscripts. As described above, the consensus logo is a cross between sequence logos and consensus sequences. As a result, compared to a sequence logo, the consensus logo omits information (the relative contribution of each character to the conservation of that position in the motif/alignment). Hence, a sequence logo should be used preferentially whenever possible. That being said, the need to include graphic figures in order to display sequence logos has perpetuated the use of consensus sequences in scientific manuscripts, even though they fail to convey information on both conservation and frequency. [5] Consensus logos represent therefore an improvement over consensus sequences whenever motif/alignment information has to be constrained to text.

Extensions

Hidden Markov models (HMMs) not only consider the information content of aligned positions in an alignment, but also of insertions and deletions. In an HMM sequence logo used by Pfam, three rows are added to indicate the frequencies of occupancy (presence) and insertion, as well as the expected insertion length. [6]

A sequence logo for TALE-likes. Note the reduced occupancy (blue) at the position one and the occasional insertion at position 19 (red). PF03377.png
A sequence logo for TALE-likes. Note the reduced occupancy (blue) at the position one and the occasional insertion at position 19 (red).

See also

Related Research Articles

<span class="mw-page-title-main">Sequence alignment</span> Process in bioinformatics that identifies equivalent sites within molecular sequences

In bioinformatics, a sequence alignment is a way of arranging the sequences of DNA, RNA, or protein to identify regions of similarity that may be a consequence of functional, structural, or evolutionary relationships between the sequences. Aligned sequences of nucleotide or amino acid residues are typically represented as rows within a matrix. Gaps are inserted between the residues so that identical or similar characters are aligned in successive columns. Sequence alignments are also used for non-biological sequences such as calculating the distance cost between strings in a natural language, or to display financial data.

Protein engineering is the process of developing useful or valuable proteins through the design and production of unnatural polypeptides, often by altering amino acid sequences found in nature. It is a young discipline, with much research taking place into the understanding of protein folding and recognition for protein design principles. It has been used to improve the function of many enzymes for industrial catalysis. It is also a product and services market, with an estimated value of $168 billion by 2017.

<span class="mw-page-title-main">Nucleic acid sequence</span> Succession of nucleotides in a nucleic acid

A nucleic acid sequence is a succession of bases within the nucleotides forming alleles within a DNA or RNA (GACU) molecule. This succession is denoted by a series of a set of five different letters that indicate the order of the nucleotides. By convention, sequences are usually presented from the 5' end to the 3' end. For DNA, with its double helix, there are two possible directions for the notated sequence; of these two, the sense strand is used. Because nucleic acids are normally linear (unbranched) polymers, specifying the sequence is equivalent to defining the covalent structure of the entire molecule. For this reason, the nucleic acid sequence is also termed the primary structure.

In bioinformatics and evolutionary biology, a substitution matrix describes the frequency at which a character in a nucleotide sequence or a protein sequence changes to other character states over evolutionary time. The information is often in the form of log odds of finding two specific character states aligned and depends on the assumed number of evolutionary changes or sequence dissimilarity between compared sequences. It is an application of a stochastic matrix. Substitution matrices are usually seen in the context of amino acid or DNA sequence alignments, where they are used to calculate similarity scores between the aligned sequences.

In biology, a sequence motif is a nucleotide or amino-acid sequence pattern that is widespread and usually assumed to be related to biological function of the macromolecule. For example, an N-glycosylation site motif can be defined as Asn, followed by anything but Pro, followed by either Ser or Thr, followed by anything but Pro residue.

In molecular biology and bioinformatics, the consensus sequence is the calculated sequence of most frequent residues, either nucleotide or amino acid, found at each position in a sequence alignment. It represents the results of multiple sequence alignments in which related sequences are compared to each other and similar sequence motifs are calculated. Such information is important when considering sequence-dependent enzymes such as RNA polymerase.

<span class="mw-page-title-main">Substitution model</span> Model of changes in a sequence over evolutionary time

In biology, a substitution model, also called models of sequence evolution, are Markov models that describe changes over evolutionary time. These models describe evolutionary changes in macromolecules, such as DNA sequences or protein sequences, that can be represented as sequence of symbols. Substitution models are used to calculate the likelihood of phylogenetic trees using multiple sequence alignment data. Thus, substitution models are central to maximum likelihood estimation of phylogeny as well as Bayesian inference in phylogeny. Estimates of evolutionary distances are typically calculated using substitution models. Substitution models are also central to phylogenetic invariants because they are necessary to predict site pattern frequencies given a tree topology. Substitution models are also necessary to simulate sequence data for a group of organisms related by a specific tree.

In molecular biology, a CCAAT box is a distinct pattern of nucleotides with GGCCAATCT consensus sequence that occur upstream by 60–100 bases to the initial transcription site. The CAAT box signals the binding site for the RNA transcription factor, and is typically accompanied by a conserved consensus sequence. It is an invariant DNA sequence at about minus 70 base pairs from the origin of transcription in many eukaryotic promoters. Genes that have this element seem to require it for the gene to be transcribed in sufficient quantities. It is frequently absent from genes that encode proteins used in virtually all cells. This box along with the GC box is known for binding general transcription factors. Both of these consensus sequences belong to the regulatory promoter. Full gene expression occurs when transcription activator proteins bind to each module within the regulatory promoter. Protein specific binding is required for the CCAAT box activation. These proteins are known as CCAAT box binding proteins/CCAAT box binding factors.

<span class="mw-page-title-main">Conserved sequence</span> Similar DNA, RNA or protein sequences within genomes or among species

In evolutionary biology, conserved sequences are identical or similar sequences in nucleic acids or proteins across species, or within a genome, or between donor and receptor taxa. Conservation indicates that a sequence has been maintained by natural selection.

<span class="mw-page-title-main">Point accepted mutation</span>

A point accepted mutation — also known as a PAM — is the replacement of a single amino acid in the primary structure of a protein with another single amino acid, which is accepted by the processes of natural selection. This definition does not include all point mutations in the DNA of an organism. In particular, silent mutations are not point accepted mutations, nor are mutations that are lethal or that are rejected by natural selection in other ways.

A position weight matrix (PWM), also known as a position-specific weight matrix (PSWM) or position-specific scoring matrix (PSSM), is a commonly used representation of motifs (patterns) in biological sequences.

<span class="mw-page-title-main">Multiple sequence alignment</span> Alignment of more than two molecular sequences

Multiple sequence alignment (MSA) is the process or the result of sequence alignment of three or more biological sequences, generally protein, DNA, or RNA. These alignments are used to infer evolutionary relationships via phylogenetic analysis and can highlight homologous features between sequences. Alignments highlight mutation events such as point mutations, insertion mutations and deletion mutations, and alignments are used to assess sequence conservation and infer the presence and activity of protein domains, tertiary structures, secondary structures, and individual amino acids or nucleotides.

<span class="mw-page-title-main">BLOSUM</span> Bioinformatics tool

In bioinformatics, the BLOSUM matrix is a substitution matrix used for sequence alignment of proteins. BLOSUM matrices are used to score alignments between evolutionarily divergent protein sequences. They are based on local alignments. BLOSUM matrices were first introduced in a paper by Steven Henikoff and Jorja Henikoff. They scanned the BLOCKS database for very conserved regions of protein families and then counted the relative frequencies of amino acids and their substitution probabilities. Then, they calculated a log-odds score for each of the 210 possible substitution pairs of the 20 standard amino acids. All BLOSUM matrices are based on observed alignments; they are not extrapolated from comparisons of closely related proteins like the PAM Matrices.

Structural and physical properties of DNA provide important constraints on the binding sites formed on surfaces of DNA-binding proteins. Characteristics of such binding sites may be used for predicting DNA-binding sites from the structural and even sequence properties of unbound proteins. This approach has been successfully implemented for predicting the protein–protein interface. Here, this approach is adopted for predicting DNA-binding sites in DNA-binding proteins. First attempt to use sequence and evolutionary features to predict DNA-binding sites in proteins was made by Ahmad et al. (2004) and Ahmad and Sarai (2005). Some methods use structural information to predict DNA-binding sites and therefore require a three-dimensional structure of the protein, while others use only sequence information and do not require protein structure in order to make a prediction.

Statistical coupling analysis or SCA is a technique used in bioinformatics to measure covariation between pairs of amino acids in a protein multiple sequence alignment (MSA). More specifically, it quantifies how much the amino acid distribution at some position i changes upon a perturbation of the amino acid distribution at another position j. The resulting statistical coupling energy indicates the degree of evolutionary dependence between the residues, with higher coupling energy corresponding to increased dependence.

<span class="mw-page-title-main">HMMER</span> Software package for sequence analysis

HMMER is a free and commonly used software package for sequence analysis written by Sean Eddy. Its general usage is to identify homologous protein or nucleotide sequences, and to perform sequence alignments. It detects homology by comparing a profile-HMM to either a single sequence or a database of sequences. Sequences that score significantly better to the profile-HMM compared to a null model are considered to be homologous to the sequences that were used to construct the profile-HMM. Profile-HMMs are constructed from a multiple sequence alignment in the HMMER package using the hmmbuild program. The profile-HMM implementation used in the HMMER software was based on the work of Krogh and colleagues. HMMER is a console utility ported to every major operating system, including different versions of Linux, Windows, and macOS.

CS-BLAST (Context-Specific BLAST) is a tool that searches a protein sequence that extends BLAST, using context-specific mutation probabilities. More specifically, CS-BLAST derives context-specific amino-acid similarities on each query sequence from short windows on the query sequences. Using CS-BLAST doubles sensitivity and significantly improves alignment quality without a loss of speed in comparison to BLAST. CSI-BLAST is the context-specific analog of PSI-BLAST, which computes the mutation profile with substitution probabilities and mixes it with the query profile. CSI-BLAST is the context specific analog of PSI-BLAST. Both of these programs are available as web-server and are available for free download.

Biological data visualization is a branch of bioinformatics concerned with the application of computer graphics, scientific visualization, and information visualization to different areas of the life sciences. This includes visualization of sequences, genomes, alignments, phylogenies, macromolecular structures, systems biology, microscopy, and magnetic resonance imaging data. Software tools used for visualizing biological data range from simple, standalone programs to complex, integrated systems.

The Walker A and Walker B motifs are protein sequence motifs, known to have highly conserved three-dimensional structures. These were first reported in ATP-binding proteins by Walker and co-workers in 1982.

Direct coupling analysis or DCA is an umbrella term comprising several methods for analyzing sequence data in computational biology. The common idea of these methods is to use statistical modeling to quantify the strength of the direct relationship between two positions of a biological sequence, excluding effects from other positions. This contrasts usual measures of correlation, which can be large even if there is no direct relationship between the positions. Such a direct relationship can for example be the evolutionary pressure for two positions to maintain mutual compatibility in the biomolecular structure of the sequence, leading to molecular coevolution between the two positions.

References

  1. 1 2 Schneider TD; Stephens RM (1990). "Sequence Logos: A New Way to Display Consensus Sequences". Nucleic Acids Res. 18 (20): 6097–6100. doi:10.1093/nar/18.20.6097. PMC   332411 . PMID   2172928.
  2. 1 2 Schneider TD; Stormo GD (1986). "Information content of binding sites on nucleotide sequences" (PDF). Journal of Molecular Biology. 188 (3): 415–431. doi:10.1016/0022-2836(86)90165-8. PMID   3525846.
  3. Basharin GP (1959). "On a statistical estimate for the entropy of a sequence of independent random variables". Theory of Probability and Its Applications. 4 (3): 333–336. doi:10.1137/1104033.
  4. Anzaldi LJ; Muñoz-Fernández D; Erill I. (2012). "BioWord: a sequence manipulation suite for Microsoft Word". BMC Bioinformatics. 13 (124): 124. doi: 10.1186/1471-2105-13-124 . PMC   3546851 . PMID   22676326.
  5. Schneider TD (2002). "Consensus Sequence Zen". Appl Bioinform. 1 (3): 111–119. PMC   1852464 . PMID   15130839.
  6. Wheeler, Travis J; Clements, Jody; Finn, Robert D (13 January 2014). "Skylign: a tool for creating informative, interactive logos representing sequence alignments and profile hidden Markov models". BMC Bioinformatics. 15 (1): 7. doi: 10.1186/1471-2105-15-7 . PMC   3893531 . PMID   24410852.