Related Research Articles
In economics and finance, arbitrage is the practice of taking advantage of a difference in prices in two or more markets; striking a combination of matching deals to capitalise on the difference, the profit being the difference between the market prices at which the unit is traded. When used by academics, an arbitrage is a transaction that involves no negative cash flow at any probabilistic or temporal state and a positive cash flow in at least one state; in simple terms, it is the possibility of a risk-free profit after transaction costs. For example, an arbitrage opportunity is present when there is the possibility to instantaneously buy something for a low price and sell it for a higher price.

A stock market, equity market, or share market is the aggregation of buyers and sellers of stocks, which represent ownership claims on businesses; these may include securities listed on a public stock exchange, as well as stock that is only traded privately, such as shares of private companies which are sold to investors through equity crowdfunding platforms. Investment is usually made with an investment strategy in mind.
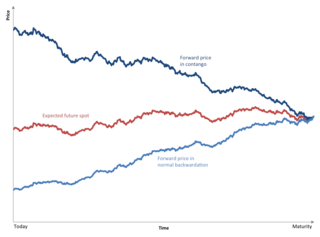
Contango is a situation where the futures price of a commodity is higher than the expected spot price of the contract at maturity. In a contango situation, arbitrageurs or speculators are "willing to pay more [now] for a commodity [to be received] at some point in the future than the actual expected price of the commodity [at that future point]. This may be due to people's desire to pay a premium to have the commodity in the future rather than paying the costs of storage and carry costs of buying the commodity today." On the other side of the trade, hedgers are happy to sell futures contracts and accept the higher-than-expected returns. A contango market is also known as a normal market, or carrying-cost market.
Investment is traditionally defined as the "commitment of resources to achieve later benefits". If an investment involves money, then it can be defined as a "commitment of money to receive more money later". From a broader viewpoint, an investment can be defined as "to tailor the pattern of expenditure and receipt of resources to optimise the desirable patterns of these flows". When expenditure and receipts are defined in terms of money, then the net monetary receipt in a time period is termed as cash flow, while money received in a series of several time periods is termed as cash flow stream. Investment science is the application of scientific tools for investments.
In finance, technical analysis is an analysis methodology for analysing and forecasting the direction of prices through the study of past market data, primarily price and volume. As a type of active management, it stands in contradiction to much of modern portfolio theory. The efficacy of technical analysis is disputed by the efficient-market hypothesis, which states that stock market prices are essentially unpredictable, and research on whether technical analysis offers any benefit has produced mixed results.

In finance, being short in an asset means investing in such a way that the investor will profit if the value of the asset falls. This is the opposite of a more conventional "long" position, where the investor will profit if the value of the asset rises.

Day trading is a form of speculation in securities in which a trader buys and sells a financial instrument within the same trading day, so that all positions are closed before the market closes for the trading day to avoid unmanageable risks and negative price gaps between one day's close and the next day's price at the open. Traders who trade in this capacity are generally classified as speculators. Day trading contrasts with the long-term trades underlying buy-and-hold and value investing strategies. Day trading may require fast trade execution, sometimes as fast as milli-seconds in scalping, therefore direct-access day trading software is often needed.
A hedge is an investment position intended to offset potential losses or gains that may be incurred by a companion investment. A hedge can be constructed from many types of financial instruments, including stocks, exchange-traded funds, insurance, forward contracts, swaps, options, gambles, many types of over-the-counter and derivative products, and futures contracts.
Contrarian investing is an investment strategy that is characterized by purchasing and selling in contrast to the prevailing sentiment of the time.

MACD, short for moving average convergence/divergence, is a trading indicator used in technical analysis of securities prices, created by Gerald Appel in the late 1970s. It is designed to reveal changes in the strength, direction, momentum, and duration of a trend in a stock's price.
Market timing is the strategy of making buying or selling decisions of financial assets by attempting to predict future market price movements. The prediction may be based on an outlook of market or economic conditions resulting from technical or fundamental analysis. This is an investment strategy based on the outlook for an aggregate market rather than for a particular financial asset.
Long/short equity is an investment strategy generally associated with hedge funds. It involves buying equities that are expected to increase in value and selling short equities that are expected to decrease in value. This is different from the risk reversal strategies where investors will simultaneously buy a call option and sell a put option to simulate being long in a stock.
In finance, an investment strategy is a set of rules, behaviors or procedures, designed to guide an investor's selection of an investment portfolio. Individuals have different profit objectives, and their individual skills make different tactics and strategies appropriate. Some choices involve a tradeoff between risk and return. Most investors fall somewhere in between, accepting some risk for the expectation of higher returns. Investors frequently pick investments to hedge themselves against inflation. During periods of high inflation investments such as shares tend to perform less well in real terms.

A pairs trade or pair trading is a market neutral trading strategy enabling traders to profit from virtually any market conditions: uptrend, downtrend, or sideways movement. This strategy is categorized as a statistical arbitrage and convergence trading strategy. Pair trading was pioneered by Gerry Bamberger and later led by Nunzio Tartaglia's quantitative group at Morgan Stanley in the 1980s.

A stock trader or equity trader or share trader, also called a stock investor, is a person or company involved in trading equity securities and attempting to profit from the purchase and sale of those securities. Stock traders may be an investor, agent, hedger, arbitrageur, speculator, or stockbroker. Such equity trading in large publicly traded companies may be through a stock exchange. Stock shares in smaller public companies may be bought and sold in over-the-counter (OTC) markets or in some instances in equity crowdfunding platforms.
Trend following or trend trading is a trading strategy according to which one should buy an asset when its price trend goes up, and sell when its trend goes down, expecting price movements to continue.
CAN SLIM refers to the acronym developed by the American stock research and education company Investor's Business Daily (IBD). IBD claims CANSLIM represents the seven characteristics that top-performing stocks often share before making their biggest price gains. It was developed in the 1950s by Investor's Business Daily founder William O'Neil. The method was named the top-performing investment strategy from 1998-2009 by the American Association of Individual Investors. In 2015, an exchange-traded fund (ETF) was launched focusing on the companies listed on the IBD 50, a computer generated list published by Investors Business Daily that highlights stocks based on the CAN SLIM investment criteria.
Mean reversion is a financial term for the assumption that an asset's price will tend to converge to the average price over time.
Portfolio insurance is a hedging strategy developed to limit the losses an investor might face from a declining index of stocks without having to sell the stocks themselves. The technique was pioneered by Hayne Leland and Mark Rubinstein in 1976. Since its inception, the portfolio insurance strategy has been dubiously marketed as a product. However, this is a misnomer as it is not a policy and there is no insurer of last resort.
The Vortex Indicator is a technical indicator invented by Etienne Botes and Douglas Siepman to identify the start of a new trend or the continuation of an existing trend within financial markets. It was published in the January 2010 edition of Technical Analysis of Stocks & Commodities.
References
- ↑ Graham, Benjamin (2003). The Intelligent Investor: The definitive book on value investing . New York: HarperCollins.
- ↑ Cramer, James (2009). Jim Cramer's Real Money: Sane Investing in an Insane World . New York: Simon & Schuster.
- ↑ Masteika & Rutkauskas (2012). "Research on Futures Trend Trading Strategy Based on Short Term Chart Pattern". Business Economics and Management. 13 (5).
- ↑ Lynch, Peter (2000). One Up on Wall Street : How to Use What You Already Know to Make Money in the Market . Simon & Schuster.
- ↑ Israelov & Katz (2011). "To trade or not to trade? informed trading with short-term signals for long-term investors". Financial Analysts. 67 (5).