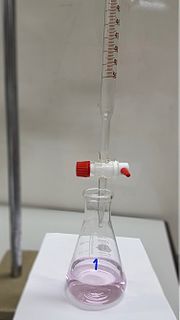
Titration is a common laboratory method of quantitative chemical analysis to determine the concentration of an identified analyte. A reagent, termed the titrant or titrator, is prepared as a standard solution of known concentration and volume. The titrant reacts with a solution of analyte to determine the analyte's concentration. The volume of titrant that reacted with the analyte is termed the titration volume.
UV spectroscopy or UV–visible spectrophotometry refers to absorption spectroscopy or reflectance spectroscopy in part of the ultraviolet and the full, adjacent visible regions of the electromagnetic spectrum. Being relatively inexpensive and easily implemented, this methodology is widely used in diverse applied and fundamental applications. The only requirement is that the sample absorb in the UV-vis region, i.e. be a chromophore. Absorption spectroscopy is complementary to fluorescence spectroscopy. Parameters of interest, besides the wavelength of measurement, are absorbance (A) or Transmittance (%T) or Reflectance (%R), and its change with time.

The enzyme-linked immunosorbent assay (ELISA) is a commonly used analytical biochemistry assay, first described by Eva Engvall and Peter Perlmann in 1971. The assay uses a solid-phase type of enzyme immunoassay (EIA) to detect the presence of a ligand in a liquid sample using antibodies directed against the protein to be measured. ELISA has been used as a diagnostic tool in medicine, plant pathology, and biotechnology, as well as a quality control check in various industries.

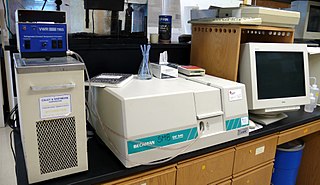
Spectrophotometry is a branch of electromagnetic spectroscopy concerned with the quantitative measurement of the reflection or transmission properties of a material as a function of wavelength. Spectrophotometry uses photometers, known as spectrophotometers, that can measure the intensity of a light beam at different wavelengths. Although spectrophotometry is most commonly applied to ultraviolet, visible, and infrared radiation, modern spectrophotometers can interrogate wide swaths of the electromagnetic spectrum, including x-ray, ultraviolet, visible, infrared, and/or microwave wavelengths.
An assay is an investigative (analytic) procedure in laboratory medicine, mining, pharmacology, environmental biology and molecular biology for qualitatively assessing or quantitatively measuring the presence, amount, or functional activity of a target entity. The measured entity is often called the analyte, the measurand, or the target of the assay. The analyte can be a drug, biochemical substance, chemical element or compound, or cell in an organism or organic sample. An assay usually aims to measure an analyte's intensive property and express it in the relevant measurement unit.

In analytical chemistry, a calibration curve, also known as a standard curve, is a general method for determining the concentration of a substance in an unknown sample by comparing the unknown to a set of standard samples of known concentration. A calibration curve is one approach to the problem of instrument calibration; other standard approaches may mix the standard into the unknown, giving an internal standard. The calibration curve is a plot of how the instrumental response, the so-called analytical signal, changes with the concentration of the analyte.
The Bradford protein assay was developed by Marion M. Bradford in 1976. It is a quick and accurate spectroscopic analytical procedure used to measure the concentration of protein in a solution. The reaction is dependent on the amino acid composition of the measured proteins.
The limit of detection is the lowest signal, or the lowest corresponding quantity to be determined from the signal, that can be observed with a sufficient degree of confidence or statistical significance. However, the exact threshold used to decide when a signal significantly emerges above the continuously fluctuating background noise remains arbitrary and is a matter of policy and often of debate among scientists, statisticians and regulators depending on the stakes in different fields.
Protein methods are the techniques used to study proteins. There are experimental methods for studying proteins. Computational methods typically use computer programs to analyze proteins. However, many experimental methods require computational analysis of the raw data.
Enzyme assays are laboratory methods for measuring enzymatic activity. They are vital for the study of enzyme kinetics and enzyme inhibition.
Oxygen radical absorbance capacity (ORAC) was a method of measuring antioxidant capacities in biological samples in vitro. Because no physiological proof in vivo existed in support of the free-radical theory or that ORAC provided information relevant to biological antioxidant potential, it was withdrawn in 2012.

The bicinchoninic acid assay, also known as the Smith assay, after its inventor, Paul K. Smith at the Pierce Chemical Company, now part of Thermo Fisher Scientific, is a biochemical assay for determining the total concentration of protein in a solution, similar to Lowry protein assay, Bradford protein assay or biuret reagent. The total protein concentration is exhibited by a color change of the sample solution from green to purple in proportion to protein concentration, which can then be measured using colorimetric techniques.
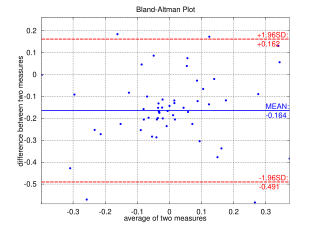
A Bland–Altman plot in analytical chemistry or biomedicine is a method of data plotting used in analyzing the agreement between two different assays. It is identical to a Tukey mean-difference plot, the name by which it is known in other fields, but was popularised in medical statistics by J. Martin Bland and Douglas G. Altman.

The dose–response relationship, or exposure–response relationship, describes the magnitude of the response of an organism, as a function of exposure to a stimulus or stressor after a certain exposure time. Dose–response relationships can be described by dose–response curves. This is explained further in the following sections. A stimulus response function or stimulus response curve is defined more broadly as the response from any type of stimulus, not limited to chemicals.

The Spectronic 20 is a brand of single-beam spectrophotometer, designed to operate in the visible spectrum across a wavelength range of 340 nm to 950 nm, with a spectral bandpass of 20 nm. It is designed for quantitative absorption measurement at single wavelengths. Because it measures the transmittance or absorption of visible light through a solution, it is sometimes referred to as a colorimeter. The name of the instrument is a trademark of the manufacturer.
The Lowry protein assay is a biochemical assay for determining the total level of protein in a solution. The total protein concentration is exhibited by a color change of the sample solution in proportion to protein concentration, which can then be measured using colorimetric techniques. It is named for the biochemist Oliver H. Lowry who developed the reagent in the 1940s. His 1951 paper describing the technique is the most-highly cited paper ever in the scientific literature, cited over 300,000 times.
The method of standard addition is a type of quantitative analysis approach often used in analytical chemistry whereby the standard is added directly to the aliquots of analyzed sample. This method is used in situations where sample matrix also contributes to the analytical signal, a situation known as the matrix effect, thus making it impossible to compare the analytical signal between sample and standard using the traditional calibration curve approach.
In physical and analytical chemistry, colorimetry or colourimetry is a technique used to determine the concentration of colored compounds in solution. A colorimeter is a device used to test the concentration of a solution by measuring its absorbance of a specific wavelength of light.
Virus quantification involves counting the number of viruses in a specific volume to determine the virus concentration. It is utilized in both research and development (R&D) in commercial and academic laboratories as well as production situations where the quantity of virus at various steps is an important variable. For example, the production of viral vaccines, recombinant proteins using viral vectors and viral antigens all require virus quantification to continually adapt and monitor the process in order to optimize production yields and respond to ever changing demands and applications. Examples of specific instances where known viruses need to be quantified include clone screening, multiplicity of infection (MOI) optimization and adaptation of methods to cell culture. This page discusses various techniques currently used to quantify viruses in liquid samples. These methods are separated into two categories, traditional vs. modern methods. Traditional methods are industry-standard methods that have been used for decades but are generally slow and labor-intensive. Modern methods are relatively new commercially available products and kits that greatly reduce quantification time. This is not meant to be an exhaustive review of all potential methods, but rather a representative cross-section of traditional methods and new, commercially available methods. While other published methods may exist for virus quantification, non-commercial methods are not discussed here.
The Dumas method in analytical chemistry is a method for the quantitative determination of nitrogen in chemical substances based on a method first described by Jean-Baptiste Dumas in 1826.

