In mathematics, the discrete Fourier transform (DFT) converts a finite sequence of equally-spaced samples of a function into a same-length sequence of equally-spaced samples of the discrete-time Fourier transform (DTFT), which is a complex-valued function of frequency. The interval at which the DTFT is sampled is the reciprocal of the duration of the input sequence. An inverse DFT (IDFT) is a Fourier series, using the DTFT samples as coefficients of complex sinusoids at the corresponding DTFT frequencies. It has the same sample-values as the original input sequence. The DFT is therefore said to be a frequency domain representation of the original input sequence. If the original sequence spans all the non-zero values of a function, its DTFT is continuous, and the DFT provides discrete samples of one cycle. If the original sequence is one cycle of a periodic function, the DFT provides all the non-zero values of one DTFT cycle.

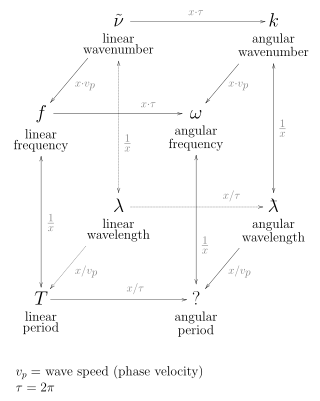
Frequency is the number of occurrences of a repeating event per unit of time. It is also occasionally referred to as temporal frequency for clarity and to distinguish it from spatial frequency. Frequency is measured in hertz (Hz) which is equal to one event per second. Ordinary frequency is related to angular frequency by a scaling factor of 2π. The period is the interval of time between events, so the period is the reciprocal of the frequency.

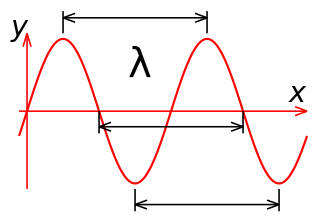
In physics and mathematics, wavelength or spatial period of a wave or periodic function is the distance over which the wave's shape repeats. In other words, it is the distance between consecutive corresponding points of the same phase on the wave, such as two adjacent crests, troughs, or zero crossings. Wavelength is a characteristic of both traveling waves and standing waves, as well as other spatial wave patterns. The inverse of the wavelength is called the spatial frequency. Wavelength is commonly designated by the Greek letter lambda (λ). The term "wavelength" is also sometimes applied to modulated waves, and to the sinusoidal envelopes of modulated waves or waves formed by interference of several sinusoids.

In physics and mathematics, the Fourier transform (FT) is a transform that converts a function into a form that describes the frequencies present in the original function. The output of the transform is a complex-valued function of frequency. The term Fourier transform refers to both this complex-valued function and the mathematical operation. When a distinction needs to be made the Fourier transform is sometimes called the frequency domain representation of the original function. The Fourier transform is analogous to decomposing the sound of a musical chord into terms of the intensity of its constituent pitches.

In the physical sciences, the wavenumber, also known as repetency, is the spatial frequency of a wave, measured in cycles per unit distance or radians per unit distance. It is analogous to temporal frequency, which is defined as the number of wave cycles per unit time or radians per unit time.

In optics and in wave propagation in general, dispersion is the phenomenon in which the phase velocity of a wave depends on its frequency; sometimes the term chromatic dispersion is used for specificity to optics in particular. A medium having this common property may be termed a dispersive medium.

A parabolic antenna is an antenna that uses a parabolic reflector, a curved surface with the cross-sectional shape of a parabola, to direct the radio waves. The most common form is shaped like a dish and is popularly called a dish antenna or parabolic dish. The main advantage of a parabolic antenna is that it has high directivity. It functions similarly to a searchlight or flashlight reflector to direct radio waves in a narrow beam, or receive radio waves from one particular direction only. Parabolic antennas have some of the highest gains, meaning that they can produce the narrowest beamwidths, of any antenna type. In order to achieve narrow beamwidths, the parabolic reflector must be much larger than the wavelength of the radio waves used, so parabolic antennas are used in the high frequency part of the radio spectrum, at UHF and microwave (SHF) frequencies, at which the wavelengths are small enough that conveniently-sized reflectors can be used.
Fourier optics is the study of classical optics using Fourier transforms (FTs), in which the waveform being considered is regarded as made up of a combination, or superposition, of plane waves. It has some parallels to the Huygens–Fresnel principle, in which the wavefront is regarded as being made up of a combination of spherical wavefronts whose sum is the wavefront being studied. A key difference is that Fourier optics considers the plane waves to be natural modes of the propagation medium, as opposed to Huygens–Fresnel, where the spherical waves originate in the physical medium.

A sine wave, sinusoidal wave, or just sinusoid is a mathematical curve defined in terms of the sine trigonometric function, of which it is the graph. It is a type of continuous wave and also a smooth periodic function. It occurs often in mathematics, as well as in physics, engineering, signal processing and many other fields.

A sensor array is a group of sensors, usually deployed in a certain geometry pattern, used for collecting and processing electromagnetic or acoustic signals. The advantage of using a sensor array over using a single sensor lies in the fact that an array adds new dimensions to the observation, helping to estimate more parameters and improve the estimation performance. For example an array of radio antenna elements used for beamforming can increase antenna gain in the direction of the signal while decreasing the gain in other directions, i.e., increasing signal-to-noise ratio (SNR) by amplifying the signal coherently. Another example of sensor array application is to estimate the direction of arrival of impinging electromagnetic waves. The related processing method is called array signal processing. A third examples includes chemical sensor arrays, which utilize multiple chemical sensors for fingerprint detection in complex mixtures or sensing environments. Application examples of array signal processing include radar/sonar, wireless communications, seismology, machine condition monitoring, astronomical observations fault diagnosis, etc.
In electromagnetics and antenna theory, the aperture of an antenna is defined as "A surface, near or on an antenna, on which it is convenient to make assumptions regarding the field values for the purpose of computing fields at external points. The aperture is often taken as that portion of a plane surface near the antenna, perpendicular to the direction of maximum radiation, through which the major part of the radiation passes."

In mathematics, physics, and engineering, spatial frequency is a characteristic of any structure that is periodic across position in space. The spatial frequency is a measure of how often sinusoidal components of the structure repeat per unit of distance. The SI unit of spatial frequency is cycles per meter (m). In image-processing applications, spatial frequency is often expressed in units of cycles per millimeter (mm) or equivalently line pairs per mm.

In electromagnetics, directivity is a parameter of an antenna or optical system which measures the degree to which the radiation emitted is concentrated in a single direction. It is the ratio of the radiation intensity in a given direction from the antenna to the radiation intensity averaged over all directions. Therefore, the directivity of a hypothetical isotropic radiator is 1, or 0 dBi.
In statistical signal processing, the goal of spectral density estimation (SDE) or simply spectral estimation is to estimate the spectral density of a signal from a sequence of time samples of the signal. Intuitively speaking, the spectral density characterizes the frequency content of the signal. One purpose of estimating the spectral density is to detect any periodicities in the data, by observing peaks at the frequencies corresponding to these periodicities.

The contrast transfer function (CTF) mathematically describes how aberrations in a transmission electron microscope (TEM) modify the image of a sample. This contrast transfer function (CTF) sets the resolution of high-resolution transmission electron microscopy (HRTEM), also known as phase contrast TEM.

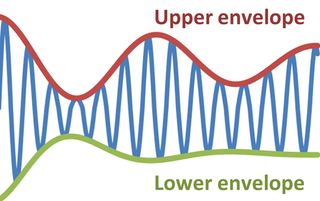
In physics and engineering, the envelope of an oscillating signal is a smooth curve outlining its extremes. The envelope thus generalizes the concept of a constant amplitude into an instantaneous amplitude. The figure illustrates a modulated sine wave varying between an upper envelope and a lower envelope. The envelope function may be a function of time, space, angle, or indeed of any variable.

As described here, white light interferometry is a non-contact optical method for surface height measurement on 3D structures with surface profiles varying between tens of nanometers and a few centimeters. It is often used as an alternative name for coherence scanning interferometry in the context of areal surface topography instrumentation that relies on spectrally-broadband, visible-wavelength light.
Multidimension spectral estimation is a generalization of spectral estimation, normally formulated for one-dimensional signals, to multidimensional signals or multivariate data, such as wave vectors.
Optical coherence tomography (OCT) is a technique that displays images of the tissue by using the backscattered light.

For discrete aperture antennas in which the element spacing is greater than a half wavelength, a spatial aliasing effect allows plane waves incident to the array from visible angles other than the desired direction to be coherently added, causing grating lobes. Grating lobes are undesirable and identical to the main lobe. The perceived difference seen in the grating lobes is because of the radiation pattern of non-isotropic antenna elements, which effects main and grating lobes differently. For isotropic antenna elements, the main and grating lobes are identical.


