Related Research Articles

Gnumeric is a spreadsheet program that is part of the GNOME Free Software Desktop Project. Gnumeric version 1.0 was released on 31 December 2001. Gnumeric is distributed as free software under the GNU General Public License; it is intended to replace proprietary spreadsheet programs like Microsoft Excel. Gnumeric was created and developed by Miguel de Icaza, but he has since moved on to other projects. The maintainer as of 2002 was Jody Goldberg.

Microsoft Excel is a spreadsheet editor developed by Microsoft for Windows, macOS, Android, iOS and iPadOS. It features calculation or computation capabilities, graphing tools, pivot tables, and a macro programming language called Visual Basic for Applications (VBA). Excel forms part of the Microsoft 365 suite of software.
A spreadsheet is a computer application for computation, organization, analysis and storage of data in tabular form. Spreadsheets were developed as computerized analogs of paper accounting worksheets. The program operates on data entered in cells of a table. Each cell may contain either numeric or text data, or the results of formulas that automatically calculate and display a value based on the contents of other cells. The term spreadsheet may also refer to one such electronic document.
Lotus Symphony was an integrated software package for creating and editing text, spreadsheets, charts and other documents on the MS-DOS operating systems. It was released by Lotus Development as a follow-on to its popular spreadsheet program, Lotus 1-2-3, and was produced from 1984 to 1992. Lotus Jazz on the Apple Macintosh was a sibling product.

SPSS Statistics is a statistical software suite developed by IBM for data management, advanced analytics, multivariate analysis, business intelligence, and criminal investigation. Long produced by SPSS Inc., it was acquired by IBM in 2009. Versions of the software released since 2015 have the brand name IBM SPSS Statistics.
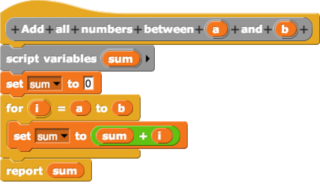
In computing, a visual programming language, also known as diagrammatic programming, graphical programming or block coding, is a programming language that lets users create programs by manipulating program elements graphically rather than by specifying them textually. A VPL allows programming with visual expressions, spatial arrangements of text and graphic symbols, used either as elements of syntax or secondary notation. For example, many VPLs are based on the idea of "boxes and arrows", where boxes or other screen objects are treated as entities, connected by arrows, lines or arcs which represent relations. VPLs are generally the basis of Low-code development platforms.
Wingz was a spreadsheet program sold by Informix in the late 1980s and early 1990s. Originally developed for the Macintosh, it was later ported to Microsoft Windows, OS/2, NeXTSTEP and several other commercial flavors of Unix. In spite of many positive reviews, including one calling it "clearly the spreadsheet of the future", the market was rapidly entrenching Microsoft Excel. Informix eventually gave up on the desktop market and reverted solely to database sales in the mid-1990s. Claris licensed and sold an extensively cleaned up version as Claris Resolve in 1991, but it was far too late to market to have any effect.

RKWard is a transparent front-end to the R programming language, a scripting-language with a strong focus on statistics functions. RKWard tries to combine the power of the R language with the ease of use of commercial statistical packages.

Stata is a general-purpose statistical software package developed by StataCorp for data manipulation, visualization, statistics, and automated reporting. It is used by researchers in many fields, including biomedicine, economics, epidemiology, and sociology.
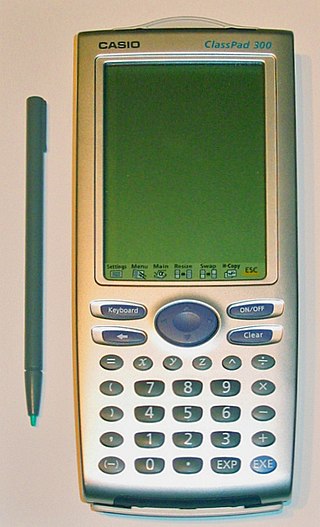
The Casio ClassPad 300, ClassPad 330 and fx-CP400 are stylus based touch-screen graphing calculators. It comes with a collection of applications that support self-study, like 3D Graph, Geometry, eActivity, Spreadsheet, etc. A large 160x240 pixel LCD touch screen enables stylus-based operation. It resembles Casio's earlier Pocket Viewer line. HP and Texas Instruments attempted to release similar pen based calculators (the HP Xpander and PET Project, but both were cancelled before release to the market.
The Apple Developer Tools are a suite of software tools from Apple to aid in making software dynamic titles for the macOS and iOS platforms. The developer tools were formerly included on macOS install media, but are now exclusively distributed over the Internet. As of MacOS 14.6.1, Xcode is available as a free download from the Mac App Store.
Origin is a proprietary computer program for interactive scientific graphing and data analysis. It is produced by OriginLab Corporation, and runs on Microsoft Windows. It has inspired several platform-independent open-source clones and alternatives like LabPlot and SciDAVis.

Numbers is a spreadsheet application developed by Apple Inc. as part of the iWork productivity suite alongside Keynote and Pages. Numbers is available for iOS and macOS High Sierra or newer. Numbers 1.0 on Mac OS X was announced on August 7, 2007, making it the newest application in the iWork suite. The iPad version was released on January 27, 2010. The app was later updated to support iPhone and iPod Touch.
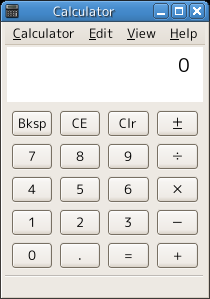
A software calculator is a calculator that has been implemented as a computer program, rather than as a physical hardware device.
StatView is a statistics application originally released for Apple Macintosh computers in 1985.

SOFA Statistics is an open-source statistical package. The name stands for Statistics Open For All. It has a graphical user interface and can connect directly to MySQL, PostgreSQL, SQLite, MS Access (map), and Microsoft SQL Server. Data can also be imported from CSV and Tab-Separated files or spreadsheets. The main statistical tests available are Independent and Paired t-tests, Wilcoxon signed ranks, Mann–Whitney U, Pearson's chi squared, Kruskal Wallis H, one-way ANOVA, Spearman's R, and Pearson's R. Nested tables can be produced with row and column percentages, totals, standard deviation, mean, median, lower and upper quartiles, and sum.
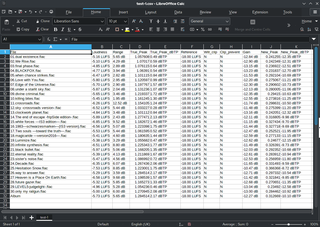
LibreOffice Calc is the spreadsheet component of the LibreOffice software package.
References
- 1 2 Webster West "The Impact Of Technology On The Teaching Of Statistics" Consortium for the Advancement of Undergraduate Statistics Education (2012)
- 1 2 Webster West "StatCrunch" MERLOT (January 2017)
- 1 2 StatCrunch release notes Pearson
- ↑ "Pearson Acquires Major Statistical Software Firm, Integrated Analytics" Pearson (July 28, 2016)
- ↑ Getting started with StatCrunch Pearson
- ↑ Sylvie Noël, Communications Research Centre, Canada, and Daniel Lemire, UQAM, Canada "Chapter 4, On the Challenges of Collaborative Data Processing" pages 61-62, Collaborative Information Behavior: User Engagement and Communication, IGI Global (2010)
- ↑ Interacting with Graphics Pearson