
The Steinhaus longimeter, patented by the professor Hugo Steinhaus, is an instrument used to measure the lengths of curves on maps.
The Steinhaus longimeter, patented by the professor Hugo Steinhaus, is an instrument used to measure the lengths of curves on maps.
It is a transparent sheet of three grids, turned against each other by 30 degrees, each consisting of parallel lines spaced at equal distances 3.82 mm. The measurement is done by counting crossings of the curve with grid lines. The number of crossings is the approximate length of the curve in millimetres.
The design of the Steinhaus longimeter can be seen as an application of the Crofton formula, according to which the length of a curve equals the expected number of times it is crossed by a random line. [1]
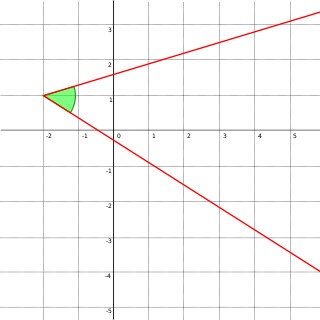
In Euclidean geometry, an angle is the figure formed by two rays, called the sides of the angle, sharing a common endpoint, called the vertex of the angle. Angles formed by two rays lie in the plane that contains the rays. Angles are also formed by the intersection of two planes. These are called dihedral angles. Two intersecting curves may also define an angle, which is the angle of the rays lying tangent to the respective curves at their point of intersection.

The metre is the base unit of length in the International System of Units (SI).
In digital imaging, a pixel, pel, or picture element is the smallest addressable element in a raster image, or the smallest point in an all points addressable display device. In most digital display devices, pixels are the smallest element that can be manipulated through software.
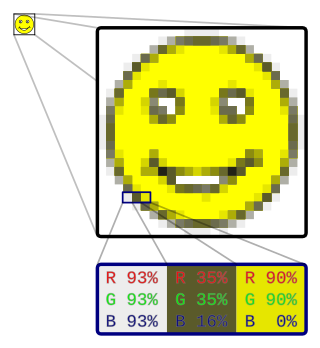
In computer graphics and digital photography, a raster graphic represents a two-dimensional picture as a rectangular matrix or grid of square pixels, viewable via a computer display, paper, or other display medium. A raster is technically characterized by the width and height of the image in pixels and by the number of bits per pixel. Raster images are stored in image files with varying dissemination, production, generation, and acquisition formats.

A sphere is a geometrical object that is a three-dimensional analogue to a two-dimensional circle. A sphere is the set of points that are all at the same distance r from a given point in three-dimensional space. That given point is the centre of the sphere, and r is the sphere's radius. The earliest known mentions of spheres appear in the work of the ancient Greek mathematicians.

The geographic coordinate system (GCS) is a spherical or ellipsoidal coordinate system for measuring and communicating positions directly on the Earth as latitude and longitude. It is the simplest, oldest and most widely used of the various spatial reference systems that are in use, and forms the basis for most others. Although latitude and longitude form a coordinate tuple like a cartesian coordinate system, the geographic coordinate system is not cartesian because the measurements are angles and are not on a planar surface.

A ruler, sometimes called a rule, line gauge, or scale, is an instrument used to make distance measurements whereby a user estimates a distance by reading from a series of markings called "rules" along an edge of the device. Commonly the instrument is rigid and the edge itself is a straightedge which additionally allows one to draw straight lines. Some rulers such as cloth or paper tape measures are non-rigid. Specialty rulers exist that have flexible edges that retain a chosen shape and these find use in sewing, arts, and crafts.

Hugo Dyonizy Steinhaus was a Polish mathematician and educator. Steinhaus obtained his PhD under David Hilbert at Göttingen University in 1911 and later became a professor at the Jan Kazimierz University in Lwów, where he helped establish what later became known as the Lwów School of Mathematics. He is credited with "discovering" mathematician Stefan Banach, with whom he gave a notable contribution to functional analysis through the Banach–Steinhaus theorem. After World War II Steinhaus played an important part in the establishment of the mathematics department at Wrocław University and in the revival of Polish mathematics from the destruction of the war.
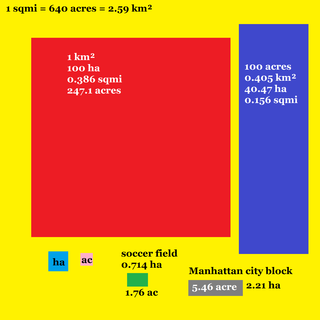
Square kilometre or square kilometer, symbol km2, is a multiple of the square metre, the SI unit of area or surface area.
The foot (pl. feet), standard symbol: ft, is a unit of length in the British imperial and United States customary systems of measurement. The prime symbol, ′, is a customarily used alternative symbol. In both customary and imperial units, one foot comprises 12 inches, and one yard comprises three feet.

A Rogowski coil, named after Walter Rogowski, is an electrical device for measuring alternating current (AC) or high-speed current pulses. It sometimes consists of a helical coil of wire with the lead from one end returning through the centre of the coil to the other end so that both terminals are at the same end of the coil. This approach is sometimes referred to as a counter-wound Rogowski.

A tape measure or measuring tape is a flexible ruler used to measure length or distance.
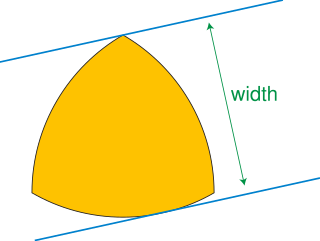
In geometry, a curve of constant width is a simple closed curve in the plane whose width is the same in all directions. The shape bounded by a curve of constant width is a body of constant width or an orbiform, the name given to these shapes by Leonhard Euler. Standard examples are the circle and the Reuleaux triangle. These curves can also be constructed using circular arcs centered at crossings of an arrangement of lines, as the involutes of certain curves, or by intersecting circles centered on a partial curve.

A Reuleaux triangle[ʁœlo] is a curved triangle with constant width, the simplest and best known curve of constant width other than the circle. It is formed from the intersection of three circular disks, each having its center on the boundary of the other two. Constant width means that the separation of every two parallel supporting lines is the same, independent of their orientation. Because its width is constant, the Reuleaux triangle is one answer to the question "Other than a circle, what shape can a manhole cover be made so that it cannot fall down through the hole?"

An opisometer, also called a curvimeter, meilograph, or map measurer, is an instrument for measuring the lengths of arbitrary curved lines.

A contour line of a function of two variables is a curve along which the function has a constant value, so that the curve joins points of equal value. It is a plane section of the three-dimensional graph of the function parallel to the -plane. More generally, a contour line for a function of two variables is a curve connecting points where the function has the same particular value.

The coastline paradox is the counterintuitive observation that the coastline of a landmass does not have a well-defined length. This results from the fractal curve-like properties of coastlines; i.e., the fact that a coastline typically has a fractal dimension. Although the "paradox of length" was previously noted by Hugo Steinhaus, the first systematic study of this phenomenon was by Lewis Fry Richardson, and it was expanded upon by Benoit Mandelbrot.
Forest inventory is the systematic collection of data and forest information for assessment or analysis. An estimate of the value and possible uses of timber is an important part of the broader information required to sustain ecosystems. When taking forest inventory the following are important things to measure and note: species, diameter at breast height (DBH), height, site quality, age, and defects. From the data collected one can calculate the number of trees per acre, the basal area, the volume of trees in an area, and the value of the timber. Inventories can be done for other reasons than just calculating the value. A forest can be cruised to visually assess timber and determine potential fire hazards and the risk of fire. The results of this type of inventory can be used in preventive actions and also awareness. Wildlife surveys can be undertaken in conjunction with timber inventory to determine the number and type of wildlife within a forest. The aim of the statistical forest inventory is to provide comprehensive information about the state and dynamics of forests for strategic and management planning. Merely looking at the forest for assessment is called taxation.
In forestry, a tree crown measurement is one of the tree measurements taken at the crown of a tree, which consists of the mass of foliage and branches growing outward from the trunk of the tree. The average crown spread is the average horizontal width of the crown, taken from dripline to dripline as one moves around the crown. The dripline is the outer boundary to the area located directly under the outer circumference of the tree branches. When the tree canopy gets wet, any excess water is shed to the ground along this dripline. Some listings will also list the maximum crown spread which represents the greatest width from dripline to dripline across the crown. Other crown measurements that are commonly taken include limb length, crown volume, and foliage density. Canopy mapping surveys the position and size of all of the limbs down to a certain size in the crown of the tree and is commonly used when measuring the overall wood volume of a tree.

A dot planimeter is a device used in planimetrics for estimating the area of a shape, consisting of a transparent sheet containing a square grid of dots. To estimate the area of a shape, the sheet is overlaid on the shape and the dots within the shape are counted. The estimate of area is the number of dots counted multiplied by the area of a single grid square. In some variations, dots that land on or near the boundary of the shape are counted as half of a unit. The dots may also be grouped into larger square groups by lines drawn onto the transparency, allowing groups that are entirely within the shape to be added to the count rather than requiring their dots to be counted one by one.
| | This mathematics-related article is a stub. You can help Wikipedia by expanding it. |