Passive management is an investing strategy that tracks a market-weighted index or portfolio. Passive management is most common on the equity market, where index funds track a stock market index, but it is becoming more common in other investment types, including bonds, commodities and hedge funds.
Investment is traditionally defined as the "commitment of resources to achieve later benefits". If an investment involves money, then it can be defined as a "commitment of money to receive more money later". From a broader viewpoint, an investment can be defined as "to tailor the pattern of expenditure and receipt of resources to optimise the desirable patterns of these flows". When expenditures and receipts are defined in terms of money, then the net monetary receipt in a time period is termed cash flow, while money received in a series of several time periods is termed cash flow stream.

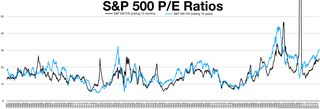
The price–earnings ratio, also known as P/E ratio, P/E, or PER, is the ratio of a company's share (stock) price to the company's earnings per share. The ratio is used for valuing companies and to find out whether they are overvalued or undervalued.
Fixed income refers to any type of investment under which the borrower or issuer is obliged to make payments of a fixed amount on a fixed schedule. For example, the borrower may have to pay interest at a fixed rate once a year and repay the principal amount on maturity. Fixed-income securities can be contrasted with equity securities that create no obligation to pay dividends or any other form of income. Bonds carry a level of legal protections for investors that equity securities do not: in the event of a bankruptcy, bond holders would be repaid after liquidation of assets, whereas shareholders with stock often receive nothing.
The equity premium puzzle refers to the inability of an important class of economic models to explain the average equity risk premium (ERP) provided by a diversified portfolio of equities over that of government bonds, which has been observed for more than 100 years. There is a significant disparity between returns produced by stocks compared to returns produced by government treasury bills. The equity premium puzzle addresses the difficulty in understanding and explaining this disparity. This disparity is calculated using the equity risk premium:
Equity risk is "the financial risk involved in holding equity in a particular investment." Equity risk is a type of market risk that applies to investing in shares. The market price of stocks fluctuates all the time, depending on supply and demand. The risk of losing money due to a reduction in the market price of shares is known as equity risk.
Business valuation is a process and a set of procedures used to estimate the economic value of an owner's interest in a business. Here various valuation techniques are used by financial market participants to determine the price they are willing to pay or receive to effect a sale of the business. In addition to estimating the selling price of a business, the same valuation tools are often used by business appraisers to resolve disputes related to estate and gift taxation, divorce litigation, allocate business purchase price among business assets, establish a formula for estimating the value of partners' ownership interest for buy-sell agreements, and many other business and legal purposes such as in shareholders deadlock, divorce litigation and estate contest.

Asset allocation is the implementation of an investment strategy that attempts to balance risk versus reward by adjusting the percentage of each asset in an investment portfolio according to the investor's risk tolerance, goals and investment time frame. The focus is on the characteristics of the overall portfolio. Such a strategy contrasts with an approach that focuses on individual assets.
A stock fund, or equity fund, is a fund that invests in stocks, also called equity securities. Stock funds can be contrasted with bond funds and money funds. Fund assets are typically mainly in stock, with some amount of cash, which is generally quite small, as opposed to bonds, notes, or other securities. This may be a mutual fund or exchange-traded fund. The objective of an equity fund is long-term growth through capital gains, although historically dividends have also been an important source of total return. Specific equity funds may focus on a certain sector of the market or may be geared toward a certain level of risk.
Style investing is an investment approach in which securities are grouped into categories, and portfolio allocation is based on selection among "styles" rather than among individual securities.
The "Fed model", or "Fed Stock Valuation Model" (FSVM), is a disputed theory of equity valuation that compares the stock market's forward earnings yield to the nominal yield on long-term government bonds, and that the stock market – as a whole – is fairly valued, when the one-year forward-looking I/B/E/S earnings yield equals the 10-year nominal Treasury yield; deviations suggest over-or-under valuation.
Zvi Bodie is an American economist, author and professor. He was the Norman and Adele Barron Professor of Management at Boston University, teaching finance at Questrom for 43 years before retiring in 2015. His textbook, Investments, (with Kane and Marcus) is the market leader and is used in the certification programs of the CFA Institute and the Society of Actuaries. Bodie's work has centered on pension finance and investment strategy. He continues to do consulting work and media interviews.
The following outline is provided as an overview of and topical guide to finance:
The risk–return spectrum is the relationship between the amount of return gained on an investment and the amount of risk undertaken in that investment. The more return sought, the more risk that must be undertaken.
Earnings growth is the annual compound annual growth rate (CAGR) of earnings from investments.
The Grinold and Kroner Model is used to calculate expected returns for a stock, stock index or the market as whole.
Dedicated portfolio theory, in finance, deals with the characteristics and features of a portfolio built to generate a predictable stream of future cash inflows. This is achieved by purchasing bonds and/or other fixed income securities that can and usually are held to maturity to generate this predictable stream from the coupon interest and/or the repayment of the face value of each bond when it matures. The goal is for the stream of cash inflows to exactly match the timing of a predictable stream of cash outflows due to future liabilities. For this reason it is sometimes called cash matching, or liability-driven investing. Determining the least expensive collection of bonds in the right quantities with the right maturities to match the cash flows is an analytical challenge that requires some degree of mathematical sophistication. College level textbooks typically cover the idea of “dedicated portfolios” or “dedicated bond portfolios” in their chapters devoted to the uses of fixed income securities.
The cyclically adjusted price-to-earnings ratio, commonly known as CAPE, Shiller P/E, or P/E 10 ratio, is a stock valuation measure usually applied to the US S&P 500 equity market. It is defined as price divided by the average of ten years of earnings, adjusted for inflation. As such, it is principally used to assess likely future returns from equities over timescales of 10 to 20 years, with higher than average CAPE values implying lower than average long-term annual average returns.
Jeremy James Siegel is an American economist who is the Russell E. Palmer Professor of Finance at the Wharton School of the University of Pennsylvania. He appears regularly on networks including CNN, CNBC and NPR, and writes regular columns for Kiplinger's Personal Finance and Yahoo! Finance. Siegel's paradox is named after him.
Low-volatility investing is an investment style that buys stocks or securities with low volatility and avoids those with high volatility. This investment style exploits the low-volatility anomaly. According to financial theory risk and return should be positively related, however in practice this is not true. Low-volatility investors aim to achieve market-like returns, but with lower risk. This investment style is also referred to as minimum volatility, minimum variance, managed volatility, smart beta, defensive and conservative investing.
