Related Research Articles

Streamlines, streaklines and pathlines are field lines in a fluid flow. They differ only when the flow changes with time, that is, when the flow is not steady. Considering a velocity vector field in three-dimensional space in the framework of continuum mechanics, we have that:

Scientific visualization is an interdisciplinary branch of science concerned with the visualization of scientific phenomena. It is also considered a subset of computer graphics, a branch of computer science. The purpose of scientific visualization is to graphically illustrate scientific data to enable scientists to understand, illustrate, and glean insight from their data. Research into how people read and misread various types of visualizations is helping to determine what types and features of visualizations are most understandable and effective in conveying information.

Visualization or visualisation is any technique for creating images, diagrams, or animations to communicate a message. Visualization through visual imagery has been an effective way to communicate both abstract and concrete ideas since the dawn of humanity. Examples from history include cave paintings, Egyptian hieroglyphs, Greek geometry, and Leonardo da Vinci's revolutionary methods of technical drawing for engineering and scientific purposes.
A stream is a body of moving water.

Ben Shneiderman is an American computer scientist, a Distinguished University Professor in the University of Maryland Department of Computer Science, which is part of the University of Maryland College of Computer, Mathematical, and Natural Sciences at the University of Maryland, College Park, and the founding director (1983-2000) of the University of Maryland Human-Computer Interaction Lab. He conducted fundamental research in the field of human–computer interaction, developing new ideas, methods, and tools such as the direct manipulation interface, and his eight rules of design.
Software visualization or software visualisation refers to the visualization of information of and related to software systems—either the architecture of its source code or metrics of their runtime behavior—and their development process by means of static, interactive or animated 2-D or 3-D visual representations of their structure, execution, behavior, and evolution.
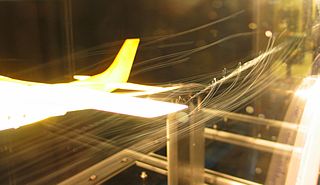
Flow visualization or flow visualisation in fluid dynamics is used to make the flow patterns visible, in order to get qualitative or quantitative information on them.

Fernanda Bertini Viégas is a Brazilian scientist and designer, whose work focuses on the social, collaborative and artistic aspects of information visualization.

Visual analytics is an outgrowth of the fields of information visualization and scientific visualization that focuses on analytical reasoning facilitated by interactive visual interfaces.
Jock D. Mackinlay is an American information visualization expert and Vice President of Research and Design at Tableau Software. With Stuart K. Card, George G. Robertson and others he invented a number of Information Visualization techniques.

Lawrence Jay Rosenblum is an American mathematician, and Program Director for Graphics and Visualization at the National Science Foundation.

A flow map is a type of thematic map that uses linear symbols to represent movement. It may thus be considered a hybrid of a map and a flow diagram. The movement being mapped may be that of anything, including people, highway traffic, trade goods, water, ideas, telecommunications data, etc. The wide variety of moving material, and the variety of geographic networks through they move, has led to many different design strategies. Some cartographers have expanded this term to any thematic map of a linear network, while others restrict its use to maps that specifically show movement of some kind.
The Information visualization reference model is an example of a reference model for information visualization, developed by Ed Chi in 1999, under the name of the data state model. Chi showed that the framework successfully modeled a wide array of visualization applications and later showed that the model was functionally equivalent to the data flow model used in existing graphics toolkits such as VTK.
Martin M. Wattenberg is an American scientist and artist known for his work with data visualization. He is currently the Gordon McKay Professor of Computer Science at the Harvard University School of Engineering and Applied Sciences.

Voreen is an open-source volume visualization library and development platform. Through the use of GPU-based volume rendering techniques it allows high frame rates on standard graphics hardware to support interactive volume exploration.

Christopher Ray Johnson is an American computer scientist. He is a Distinguished Professor of Computer Science at the University of Utah, and founding director of the Scientific Computing and Imaging Institute (SCI). His research interests are in the areas of scientific computing and scientific visualization.
In scientific visualization, Lagrangian–Eulerian advection is a technique mainly used for the visualization of unsteady flows. The computer graphics generated by the technique can help scientists visualize changes in velocity fields. This technique uses a hybrid Lagrangian and Eulerian specification of the flow field. It is a special case of a line integral convolution.

In scientific visualization, texture advection is a family of methods to densely visualize vector fields or flows. Scientists can use the created images and animations to better understand these flows and reason about them. In comparison to techniques that visualise streamlines, streaklines, or timelines, methods of this family don't need any seed points and can produce a whole image at every step.
In scientific visualization a streamsurface is the 3D generalization of a streamline. It is the union of all streamlines seeded densely on a curve. Like a streamline, a streamsurface is used to visualize flows – three-dimensional flows in this case. Specifically, it is "the locus of an infinite set of such curves [streamlines], rooted at every point along a continuous originating line segment."
Tamara Macushla Munzner is an American-Canadian scientist. She is an expert in information visualization who works as a professor of computer science at the University of British Columbia (UBC).
References
- ↑ Urness, T.; Interrante, V.; Marusic, I.; Longmire, E.; Ganapathisubramani, B. (2003). "Effectively visualizing multi-valued flow data using color and texture". IEEE Transactions on Ultrasonics, Ferroelectrics and Frequency Control. IEEE: 115–121. doi:10.1109/visual.2003.1250362. ISBN 0-7803-8120-3. S2CID 1445194.
| | This computer graphics–related article is a stub. You can help Wikipedia by expanding it. |
| | This computer science article is a stub. You can help Wikipedia by expanding it. |