Stress majorization

Last updated

Stress majorization is an optimization strategy used in multidimensional scaling (MDS) where, for a set of nm-dimensional data items, a configuration X of n points in r(<<m)-dimensional space is sought that minimizes the so-called stress function . Usually r is 2 or 3, i.e. the (n x r) matrix X lists points in 2- or 3-dimensional Euclidean space so that the result may be visualised (i.e. an MDS plot). The function is a cost or loss function that measures the squared differences between ideal (-dimensional) distances and actual distances in r-dimensional space. It is defined as:

Multidimensional scaling set of related ordination techniques used in information visualization

Multidimensional scaling (MDS) is a means of visualizing the level of similarity of individual cases of a dataset. MDS is used to translate "information about the pairwise 'distances' among a set of n objects or individuals" into a configuration of n points mapped into an abstract Cartesian space.
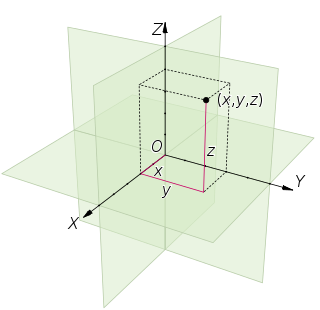
Euclidean space Generalization of Euclidean geometry to higher dimensions

In geometry, Euclidean space encompasses the two-dimensional Euclidean plane, the three-dimensional space of Euclidean geometry, and similar spaces of higher dimension. It is named after the Ancient Greek mathematician Euclid of Alexandria. The term "Euclidean" distinguishes these spaces from other types of spaces considered in modern geometry. Euclidean spaces also generalize to higher dimensions.

In mathematical optimization, statistics, econometrics, decision theory, machine learning and computational neuroscience, a loss function or cost function is a function that maps an event or values of one or more variables onto a real number intuitively representing some "cost" associated with the event. An optimization problem seeks to minimize a loss function. An objective function is either a loss function or its negative, in which case it is to be maximized.

Contents

where is a weight for the measurement between a pair of points , is the euclidean distance between and and is the ideal distance between the points (their separation) in the -dimensional data space. Note that can be used to specify a degree of confidence in the similarity between points (e.g. 0 can be specified if there is no information for a particular pair).

Euclidean distance conventional distance in mathematics and physics

In mathematics, the Euclidean distance or Euclidean metric is the "ordinary" straight-line distance between two points in Euclidean space. With this distance, Euclidean space becomes a metric space. The associated norm is called the Euclidean norm. Older literature refers to the metric as the Pythagorean metric. A generalized term for the Euclidean norm is the L2 norm or L2 distance.

A configuration which minimizes gives a plot in which points that are close together correspond to points that are also close together in the original -dimensional data space.

There are many ways that could be minimized. For example, Kruskal [1] recommended an iterative steepest descent approach. However, a significantly better (in terms of guarantees on, and rate of, convergence) method for minimizing stress was introduced by Jan de Leeuw. [2] De Leeuw's iterative majorization method at each step minimizes a simple convex function which both bounds from above and touches the surface of at a point , called the supporting point. In convex analysis such a function is called a majorizing function. This iterative majorization process is also referred to as the SMACOF algorithm ("Scaling by MAjorizing a COmplicated Function").

Jan de Leeuw is a Dutch statistician and psychometrician. He is Distinguished Professor Emeritus of Statistics and Founding Chair of the Department of Statistics, University of California, Los Angeles. In addition, he is the founding editor and former editor-in-chief of the Journal of Statistical Software, as well as the former editor-in-chief of the Journal of Multivariate Analysis and the "Journal of Educational and Behavioral Statistics".
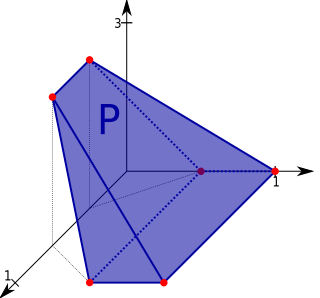
Convex analysis branch of mathematics devoted to the study of properties of convex functions and convex sets

Convex analysis is the branch of mathematics devoted to the study of properties of convex functions and convex sets, often with applications in convex minimization, a subdomain of optimization theory.

The SMACOF algorithm

The stress function can be expanded as follows:

Note that the first term is a constant and the second term is quadratic in X (i.e. for the Hessian matrix V the second term is equivalent to tr ) and therefore relatively easily solved. The third term is bounded by:

In mathematics, the Hessian matrix or Hessian is a square matrix of second-order partial derivatives of a scalar-valued function, or scalar field. It describes the local curvature of a function of many variables. The Hessian matrix was developed in the 19th century by the German mathematician Ludwig Otto Hesse and later named after him. Hesse originally used the term "functional determinants".

where has:

for

and for

and .

Proof of this inequality is by the Cauchy-Schwarz inequality, see Borg [3] (pp. 152–153).

Thus, we have a simple quadratic function that majorizes stress:


The iterative minimization procedure is then:

This algorithm has been shown to decrease stress monotonically (see de Leeuw [2] ).

Use in graph drawing

Stress majorization and algorithms similar to SMACOF also have application in the field of graph drawing. [4] [5] That is, one can find a reasonably aesthetically appealing layout for a network or graph by minimizing a stress function over the positions of the nodes in the graph. In this case, the are usually set to the graph-theoretic distances between nodes i and j and the weights are taken to be . Here, is chosen as a trade-off between preserving long- or short-range ideal distances. Good results have been shown for . [6]

Related Research Articles

Pauli matrices

In mathematical physics and mathematics, the Pauli matrices are a set of three 2 × 2 complex matrices which are Hermitian and unitary. Usually indicated by the Greek letter sigma, they are occasionally denoted by tau when used in connection with isospin symmetries. They are

Multivariate normal distribution

In probability theory and statistics, the multivariate normal distribution, multivariate Gaussian distribution, or joint normal distribution is a generalization of the one-dimensional (univariate) normal distribution to higher dimensions. One definition is that a random vector is said to be k-variate normally distributed if every linear combination of its k components has a univariate normal distribution. Its importance derives mainly from the multivariate central limit theorem. The multivariate normal distribution is often used to describe, at least approximately, any set of (possibly) correlated real-valued random variables each of which clusters around a mean value.

Log-normal distribution probability distribution

In probability theory, a log-normal distribution is a continuous probability distribution of a random variable whose logarithm is normally distributed. Thus, if the random variable X is log-normally distributed, then Y = ln(X) has a normal distribution. Likewise, if Y has a normal distribution, then the exponential function of Y, X = exp(Y), has a log-normal distribution. A random variable which is log-normally distributed takes only positive real values. The distribution is occasionally referred to as the Galton distribution or Galton's distribution, after Francis Galton. The log-normal distribution also has been associated with other names, such as McAlister, Gibrat and Cobb–Douglas.

In mathematics, the Kronecker delta is a function of two variables, usually just non-negative integers. The function is 1 if the variables are equal, and 0 otherwise:

In mathematics, Itô's lemma is an identity used in Itô calculus to find the differential of a time-dependent function of a stochastic process. It serves as the stochastic calculus counterpart of the chain rule. It can be heuristically derived by forming the Taylor series expansion of the function up to its second derivatives and retaining terms up to first order in the time increment and second order in the Wiener process increment. The lemma is widely employed in mathematical finance, and its best known application is in the derivation of the Black–Scholes equation for option values.

In linear algebra, the permanent of a square matrix is a function of the matrix similar to the determinant. The permanent, as well as the determinant, is a polynomial in the entries of the matrix. Both are special cases of a more general function of a matrix called the immanant.

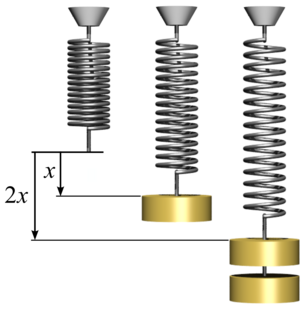
Hookes law principle of physics that states that the force (F) needed to extend or compress a spring by some distance X scales linearly with respect to that distance

Hooke's law is a law of physics that states that the force needed to extend or compress a spring by some distance x scales linearly with respect to that distance. That is: , where k is a constant factor characteristic of the spring: its stiffness, and x is small compared to the total possible deformation of the spring. The law is named after 17th-century British physicist Robert Hooke. He first stated the law in 1676 as a Latin anagram. He published the solution of his anagram in 1678 as: ut tensio, sic vis. Hooke states in the 1678 work that he was aware of the law already in 1660.

In mathematics, a Gaussian function, often simply referred to as a Gaussian, is a function of the form:

Jensens inequality

In mathematics, Jensen's inequality, named after the Danish mathematician Johan Jensen, relates the value of a convex function of an integral to the integral of the convex function. It was proven by Jensen in 1906. Given its generality, the inequality appears in many forms depending on the context, some of which are presented below. In its simplest form the inequality states that the convex transformation of a mean is less than or equal to the mean applied after convex transformation; it is a simple corollary that the opposite is true of concave transformations.

Linear elasticity is the mathematical study of how solid objects deform and become internally stressed due to prescribed loading conditions. Linear elasticity models materials as continua. Linear elasticity is a simplification of the more general nonlinear theory of elasticity and is a branch of continuum mechanics. The fundamental "linearizing" assumptions of linear elasticity are: infinitesimal strains or "small" deformations and linear relationships between the components of stress and strain. In addition linear elasticity is valid only for stress states that do not produce yielding. These assumptions are reasonable for many engineering materials and engineering design scenarios. Linear elasticity is therefore used extensively in structural analysis and engineering design, often with the aid of finite element analysis.

In matrix calculus, Jacobi's formula expresses the derivative of the determinant of a matrix A in terms of the adjugate of A and the derivative of A.

Cauchy stress tensor tensor that describes the state of stress at a point inside a material

In continuum mechanics, the Cauchy stress tensor , true stress tensor, or simply called the stress tensor is a second order tensor named after Augustin-Louis Cauchy. The tensor consists of nine components that completely define the state of stress at a point inside a material in the deformed state, placement, or configuration. The tensor relates a unit-length direction vector n to the stress vector T(n) across an imaginary surface perpendicular to n:

In fluid mechanics and mathematics, a capillary surface is a surface that represents the interface between two different fluids. As a consequence of being a surface, a capillary surface has no thickness in slight contrast with most real fluid interfaces.

In computational learning theory, Rademacher complexity, named after Hans Rademacher, measures richness of a class of real-valued functions with respect to a probability distribution.

In credibility theory, a branch of study in actuarial science, the Bühlmann model is a random effects model used in to determine the appropriate premium for a group of insurance contracts. The model is named after Hans Bühlmann who first published a description in 1967.

In statistical mechanics, the eight-vertex model is a generalisation of the ice-type (six-vertex) models; it was discussed by Sutherland, and Fan & Wu, and solved by Baxter in the zero-field case.

The purpose of this page is to provide supplementary materials for the ordinary least squares article, reducing the load of the main article with mathematics and improving its accessibility, while at the same time retaining the completeness of exposition.

For certain applications in linear algebra, it is useful to know properties of the probability distribution of the largest eigenvalue of a finite sum of random matrices. Suppose is a finite sequence of random matrices. Analogous to the well-known Chernoff bound for sums of scalars, a bound on the following is sought for a given parameter t:

In solid state physics, the Luttinger–Ward functional, proposed by Joaquin Mazdak Luttinger and John Clive Ward in 1960, is a scalar functional of the bare electron-electron interaction and the renormalized many-body Green's function. In terms of Feynman diagrams, the Luttinger–Ward functional is the sum of all closed, bold, two-particle irreducible diagrams, i.e., all diagrams without particles going in or out that do not fall apart if one removes two propagator lines. It is usually written as or , where is the Green's function and is the bare interaction.

References

  1. Kruskal, J. B. (1964), "Multidimensional scaling by optimizing goodness of fit to a nonmetric hypothesis", Psychometrika, 29 (1): 1–27, doi:10.1007/BF02289565 .
  2. 1 2 de Leeuw, J. (1977), "Applications of convex analysis to multidimensional scaling", in Barra, J. R.; Brodeau, F.; Romie, G.; et al., Recent developments in statistics, pp. 133–145.
  3. Borg, I.; Groenen, P. (1997), Modern Multidimensional Scaling: theory and applications, New York: Springer-Verlag.
  4. Michailidis, G.; de Leeuw, J. (2001), "Data visualization through graph drawing", Computation Stat., 16 (3): 435–450, CiteSeerX   10.1.1.28.9372 , doi:10.1007/s001800100077 .
  5. Gansner, E.; Koren, Y.; North, S. (2004), "Graph Drawing by Stress Majorization", Proceedings of 12th Int. Symp. Graph Drawing (GD'04), Lecture Notes in Computer Science, 3383, Springer-Verlag, pp. 239–250.
  6. Cohen, J. (1997), "Drawing graphs to convey proximity: an incremental arrangement method", ACM Transactions on Computer-Human Interaction, 4 (3): 197–229, doi:10.1145/264645.264657 .