| Look up uniform distribution in Wiktionary, the free dictionary. |
Uniform distribution may refer to:
| Look up uniform distribution in Wiktionary, the free dictionary. |
Uniform distribution may refer to:
| This disambiguation page lists articles associated with the title Uniform distribution. If an internal link led you here, you may wish to change the link to point directly to the intended article. |
In probability theory and statistics, a probability distribution is the mathematical function that gives the probabilities of occurrence of different possible outcomes for an experiment. It is a mathematical description of a random phenomenon in terms of its sample space and the probabilities of events.
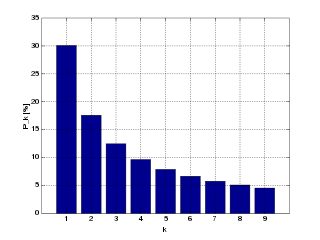
Benford's law, also called the Newcomb–Benford law, the law of anomalous numbers, or the first-digit law, is an observation about the frequency distribution of leading digits in many real-life sets of numerical data. The law states that in many naturally occurring collections of numbers, the leading digit is likely to be small. For example, in sets that obey the law, the number 1 appears as the leading significant digit about 30% of the time, while 9 appears as the leading significant digit less than 5% of the time. If the digits were distributed uniformly, they would each occur about 11.1% of the time. Benford's law also makes predictions about the distribution of second digits, third digits, digit combinations, and so on.
A pseudorandom number generator (PRNG), also known as a deterministic random bit generator (DRBG), is an algorithm for generating a sequence of numbers whose properties approximate the properties of sequences of random numbers. The PRNG-generated sequence is not truly random, because it is completely determined by an initial value, called the PRNG's seed. Although sequences that are closer to truly random can be generated using hardware random number generators, pseudorandom number generators are important in practice for their speed in number generation and their reproducibility.

Intestacy is the condition of the estate of a person who dies without having in force a valid will or other binding declaration. Alternatively this may also apply where a will or declaration has been made, but only applies to part of the estate; the remaining estate forms the "intestate estate". Intestacy law, also referred to as the law of descent and distribution, refers to the body of law that determines who is entitled to the property from the estate under the rules of inheritance.

In chemistry, the dispersity is a measure of the heterogeneity of sizes of molecules or particles in a mixture. A collection of objects is called uniform if the objects have the same size, shape, or mass. A sample of objects that have an inconsistent size, shape and mass distribution is called non-uniform. The objects can be in any form of chemical dispersion, such as particles in a colloid, droplets in a cloud, crystals in a rock, or polymer macromolecules in a solution or a solid polymer mass. Polymers can be described by molecular mass distribution; a population of particles can be described by size, surface area, and/or mass distribution; and thin films can be described by film thickness distribution.
In Bayesian statistical inference, a prior probability distribution, often simply called the prior, of an uncertain quantity is the probability distribution that would express one's beliefs about this quantity before some evidence is taken into account. For example, the prior could be the probability distribution representing the relative proportions of voters who will vote for a particular politician in a future election. The unknown quantity may be a parameter of the model or a latent variable rather than an observable variable.

In probability theory and statistics, the triangular distribution is a continuous probability distribution with lower limit a, upper limit b and mode c, where a < b and a ≤ c ≤ b.
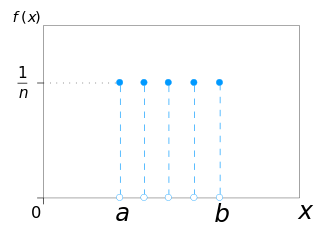
In probability theory and statistics, the discrete uniform distribution is a symmetric probability distribution wherein a finite number of values are equally likely to be observed; every one of n values has equal probability 1/n. Another way of saying "discrete uniform distribution" would be "a known, finite number of outcomes equally likely to happen".

In probability theory and statistics, the continuous uniform distribution or rectangular distribution is a family of symmetric probability distributions. The distribution describes an experiment where there is an arbitrary outcome that lies between certain bounds. The bounds are defined by the parameters, a and b, which are the minimum and maximum values. The interval can be either be closed or open. Therefore, the distribution is often abbreviated U, where U stands for uniform distribution. The difference between the bounds defines the interval length; all intervals of the same length on the distribution's support are equally probable. It is the maximum entropy probability distribution for a random variable X under no constraint other than that it is contained in the distribution's support.
In probability theory, especially in mathematical statistics, a location–scale family is a family of probability distributions parametrized by a location parameter and a non-negative scale parameter. For any random variable whose probability distribution function belongs to such a family, the distribution function of also belongs to the family. Moreover, if and are two random variables whose distribution functions are members of the family, and assuming
In Bayesian statistics, a credible interval is an interval within which an unobserved parameter value falls with a particular probability. It is an interval in the domain of a posterior probability distribution or a predictive distribution. The generalisation to multivariate problems is the credible region. Credible intervals are analogous to confidence intervals in frequentist statistics, although they differ on a philosophical basis: Bayesian intervals treat their bounds as fixed and the estimated parameter as a random variable, whereas frequentist confidence intervals treat their bounds as random variables and the parameter as a fixed value. Also, Bayesian credible intervals use knowledge of the situation-specific prior distribution, while the frequentist confidence intervals do not.

In statistics, a Q–Q (quantile-quantile) plot is a probability plot, which is a graphical method for comparing two probability distributions by plotting their quantiles against each other. First, the set of intervals for the quantiles is chosen. A point (x, y) on the plot corresponds to one of the quantiles of the second distribution plotted against the same quantile of the first distribution. Thus the line is a parametric curve with the parameter which is the number of the interval for the quantile.

Species distribution is the manner in which a biological taxon is spatially arranged. The geographic limits of a particular taxon's distribution is its range, often represented as shaded areas on a map. Patterns of distribution change depending on the scale at which they are viewed, from the arrangement of individuals within a small family unit, to patterns within a population, or the distribution of the entire species as a whole (range). Species distribution is not to be confused with dispersal, which is the movement of individuals away from their region of origin or from a population center of high density.

In probability and statistics, the Irwin–Hall distribution, named after Joseph Oscar Irwin and Philip Hall, is a probability distribution for a random variable defined as the sum of a number of independent random variables, each having a uniform distribution. For this reason it is also known as the uniform sum distribution.

In probability theory, the slash distribution is the probability distribution of a standard normal variate divided by an independent standard uniform variate. In other words, if the random variable Z has a normal distribution with zero mean and unit variance, the random variable U has a uniform distribution on [0,1] and Z and U are statistically independent, then the random variable X = Z / U has a slash distribution. The slash distribution is an example of a ratio distribution. The distribution was named by William H. Rogers and John Tukey in a paper published in 1972.
In probability theory and directional statistics, a circular uniform distribution is a probability distribution on the unit circle whose density is uniform for all angles.

In probability and statistics, the Bates distribution, named after Grace Bates, is a probability distribution of the mean of a number of statistically independent uniformly distributed random variables on the unit interval. This distribution is sometimes confused with the Irwin–Hall distribution, which is the distribution of the sum of n independent random variables uniformly distributed from 0 to 1. Thus, the two distributions are simply versions of each other as they only differ in scale.

In probability theory and statistics, the beta rectangular distribution is a probability distribution that is a finite mixture distribution of the beta distribution and the continuous uniform distribution. The support is of the distribution is indicated by the parameters a and b, which are the minimum and maximum values respectively. The distribution provides an alternative to the beta distribution such that it allows more density to be placed at the extremes of the bounded interval of support. Thus it is a bounded distribution that allows for outliers to have a greater chance of occurring than does the beta distribution.

In probability and statistics, the reciprocal distribution, also known as the log-uniform distribution, is a continuous probability distribution. It is characterised by its probability density function, within the support of the distribution, being proportional to the reciprocal of the variable.