Discrete uniform distribution

Last updated
discrete uniform
Probability mass function
Uniform discrete pmf svg.svg
n = 5 where n = b  a + 1
Cumulative distribution function
Dis Uniform distribution CDF.svg
Notation or
Parameters integers with
Support
PMF
CDF
Mean
Median
Mode N/A
Variance
Skewness
Ex. kurtosis
Entropy
MGF
CF
PGF

In probability theory and statistics, the discrete uniform distribution is a symmetric probability distribution wherein a finite number of values are equally likely to be observed; every one of n values has equal probability 1/n. Another way of saying "discrete uniform distribution" would be "a known, finite number of outcomes equally likely to happen".

Contents

A simple example of the discrete uniform distribution is throwing a fair die. The possible values are 1, 2, 3, 4, 5, 6, and each time the die is thrown the probability of a given score is 1/6. If two dice are thrown and their values added, the resulting distribution is no longer uniform because not all sums have equal probability. Although it is convenient to describe discrete uniform distributions over integers, such as this, one can also consider discrete uniform distributions over any finite set. For instance, a random permutation is a permutation generated uniformly from the permutations of a given length, and a uniform spanning tree is a spanning tree generated uniformly from the spanning trees of a given graph.

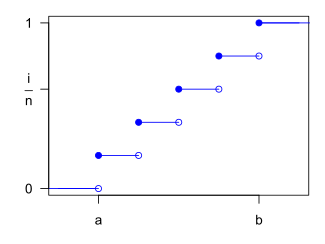
The discrete uniform distribution itself is inherently non-parametric. It is convenient, however, to represent its values generally by all integers in an interval [a,b], so that a and b become the main parameters of the distribution (often one simply considers the interval [1,n] with the single parameter n). With these conventions, the cumulative distribution function (CDF) of the discrete uniform distribution can be expressed, for any k ∈ [a,b], as

Estimation of maximum

This example is described by saying that a sample of k observations is obtained from a uniform distribution on the integers , with the problem being to estimate the unknown maximum N. This problem is commonly known as the German tank problem, following the application of maximum estimation to estimates of German tank production during World War II.

The uniformly minimum variance unbiased (UMVU) estimator for the maximum is given by

where m is the sample maximum and k is the sample size, sampling without replacement. [1] This can be seen as a very simple case of maximum spacing estimation.

This has a variance of [1]

so a standard deviation of approximately , the (population) average size of a gap between samples; compare above.

The sample maximum is the maximum likelihood estimator for the population maximum, but, as discussed above, it is biased.

If samples are not numbered but are recognizable or markable, one can instead estimate population size via the capture-recapture method.

Random permutation

See rencontres numbers for an account of the probability distribution of the number of fixed points of a uniformly distributed random permutation.

Properties

The family of uniform distributions over ranges of integers (with one or both bounds unknown) has a finite-dimensional sufficient statistic, namely the triple of the sample maximum, sample minimum, and sample size, but is not an exponential family of distributions, because the support varies with the parameters. For families whose support does not depend on the parameters, the Pitman–Koopman–Darmois theorem states that only exponential families have a sufficient statistic whose dimension is bounded as sample size increases. The uniform distribution is thus a simple example showing the limit of this theorem.

See also

Related Research Articles

<span class="mw-page-title-main">Binomial distribution</span> Probability distribution

In probability theory and statistics, the binomial distribution with parameters n and p is the discrete probability distribution of the number of successes in a sequence of n independent experiments, each asking a yes–no question, and each with its own Boolean-valued outcome: success or failure. A single success/failure experiment is also called a Bernoulli trial or Bernoulli experiment, and a sequence of outcomes is called a Bernoulli process; for a single trial, i.e., n = 1, the binomial distribution is a Bernoulli distribution. The binomial distribution is the basis for the popular binomial test of statistical significance.

<span class="mw-page-title-main">Cauchy distribution</span> Probability distribution

The Cauchy distribution, named after Augustin Cauchy, is a continuous probability distribution. It is also known, especially among physicists, as the Lorentz distribution, Cauchy–Lorentz distribution, Lorentz(ian) function, or Breit–Wigner distribution. The Cauchy distribution is the distribution of the x-intercept of a ray issuing from with a uniformly distributed angle. It is also the distribution of the ratio of two independent normally distributed random variables with mean zero.

<span class="mw-page-title-main">Estimator</span> Rule for calculating an estimate of a given quantity based on observed data

In statistics, an estimator is a rule for calculating an estimate of a given quantity based on observed data: thus the rule, the quantity of interest and its result are distinguished. For example, the sample mean is a commonly used estimator of the population mean.

<span class="mw-page-title-main">Median</span> Middle quantile of a data set or probability distribution

In statistics and probability theory, the median is the value separating the higher half from the lower half of a data sample, a population, or a probability distribution. For a data set, it may be thought of as "the middle" value. The basic feature of the median in describing data compared to the mean is that it is not skewed by a small proportion of extremely large or small values, and therefore provides a better representation of the center. Median income, for example, may be a better way to describe the center of the income distribution because increases in the largest incomes alone have no effect on the median. For this reason, the median is of central importance in robust statistics.

<span class="mw-page-title-main">Normal distribution</span> Probability distribution

In statistics, a normal distribution or Gaussian distribution is a type of continuous probability distribution for a real-valued random variable. The general form of its probability density function is

<span class="mw-page-title-main">Standard deviation</span> In statistics, a measure of variation

In statistics, the standard deviation is a measure of the amount of variation of a random variable expected about its mean. A low standard deviation indicates that the values tend to be close to the mean of the set, while a high standard deviation indicates that the values are spread out over a wider range.

In statistics, maximum likelihood estimation (MLE) is a method of estimating the parameters of an assumed probability distribution, given some observed data. This is achieved by maximizing a likelihood function so that, under the assumed statistical model, the observed data is most probable. The point in the parameter space that maximizes the likelihood function is called the maximum likelihood estimate. The logic of maximum likelihood is both intuitive and flexible, and as such the method has become a dominant means of statistical inference.

<span class="mw-page-title-main">Beta distribution</span> Probability distribution

In probability theory and statistics, the beta distribution is a family of continuous probability distributions defined on the interval [0, 1] or in terms of two positive parameters, denoted by alpha (α) and beta (β), that appear as exponents of the variable and its complement to 1, respectively, and control the shape of the distribution.

<span class="mw-page-title-main">Gamma distribution</span> Probability distribution

In probability theory and statistics, the gamma distribution is a two-parameter family of continuous probability distributions. The exponential distribution, Erlang distribution, and chi-squared distribution are special cases of the gamma distribution. There are two equivalent parameterizations in common use:

  1. With a shape parameter k and a scale parameter θ
  2. With a shape parameter and an inverse scale parameter , called a rate parameter.
<span class="mw-page-title-main">Laplace distribution</span> Probability distribution

In probability theory and statistics, the Laplace distribution is a continuous probability distribution named after Pierre-Simon Laplace. It is also sometimes called the double exponential distribution, because it can be thought of as two exponential distributions spliced together along the abscissa, although the term is also sometimes used to refer to the Gumbel distribution. The difference between two independent identically distributed exponential random variables is governed by a Laplace distribution, as is a Brownian motion evaluated at an exponentially distributed random time. Increments of Laplace motion or a variance gamma process evaluated over the time scale also have a Laplace distribution.

<span class="mw-page-title-main">Yule–Simon distribution</span> Discrete probability distribution

In probability and statistics, the Yule–Simon distribution is a discrete probability distribution named after Udny Yule and Herbert A. Simon. Simon originally called it the Yule distribution.

Estimation theory is a branch of statistics that deals with estimating the values of parameters based on measured empirical data that has a random component. The parameters describe an underlying physical setting in such a way that their value affects the distribution of the measured data. An estimator attempts to approximate the unknown parameters using the measurements. In estimation theory, two approaches are generally considered:

<span class="mw-page-title-main">Continuous uniform distribution</span> Uniform distribution on an interval

In probability theory and statistics, the continuous uniform distributions or rectangular distributions are a family of symmetric probability distributions. Such a distribution describes an experiment where there is an arbitrary outcome that lies between certain bounds. The bounds are defined by the parameters, and which are the minimum and maximum values. The interval can either be closed or open. Therefore, the distribution is often abbreviated where stands for uniform distribution. The difference between the bounds defines the interval length; all intervals of the same length on the distribution's support are equally probable. It is the maximum entropy probability distribution for a random variable under no constraint other than that it is contained in the distribution's support.

In estimation theory and decision theory, a Bayes estimator or a Bayes action is an estimator or decision rule that minimizes the posterior expected value of a loss function. Equivalently, it maximizes the posterior expectation of a utility function. An alternative way of formulating an estimator within Bayesian statistics is maximum a posteriori estimation.

In statistics, the bias of an estimator is the difference between this estimator's expected value and the true value of the parameter being estimated. An estimator or decision rule with zero bias is called unbiased. In statistics, "bias" is an objective property of an estimator. Bias is a distinct concept from consistency: consistent estimators converge in probability to the true value of the parameter, but may be biased or unbiased; see bias versus consistency for more.

In probability theory, a member of the (a, b, 0) class of distributions is any distribution of a discrete random variable N whose values are nonnegative integers whose probability mass function satisfies the recurrence formula

<span class="mw-page-title-main">Maximum spacing estimation</span> Method of estimating a statistical models parameters

In statistics, maximum spacing estimation (MSE or MSP), or maximum product of spacing estimation (MPS), is a method for estimating the parameters of a univariate statistical model. The method requires maximization of the geometric mean of spacings in the data, which are the differences between the values of the cumulative distribution function at neighbouring data points.

<span class="mw-page-title-main">Poisson distribution</span> Discrete probability distribution

In probability theory and statistics, the Poisson distribution is a discrete probability distribution that expresses the probability of a given number of events occurring in a fixed interval of time if these events occur with a known constant mean rate and independently of the time since the last event. It can also be used for the number of events in other types of intervals than time, and in dimension greater than 1.

In statistics, efficiency is a measure of quality of an estimator, of an experimental design, or of a hypothesis testing procedure. Essentially, a more efficient estimator needs fewer input data or observations than a less efficient one to achieve the Cramér–Rao bound. An efficient estimator is characterized by having the smallest possible variance, indicating that there is a small deviance between the estimated value and the "true" value in the L2 norm sense.

In computer science and data mining, MinHash is a technique for quickly estimating how similar two sets are. The scheme was invented by Andrei Broder, and initially used in the AltaVista search engine to detect duplicate web pages and eliminate them from search results. It has also been applied in large-scale clustering problems, such as clustering documents by the similarity of their sets of words.

References

  1. 1 2 Johnson, Roger (1994), "Estimating the Size of a Population", Teaching Statistics, 16 (2 (Summer)): 50–52, CiteSeerX   10.1.1.385.5463 , doi:10.1111/j.1467-9639.1994.tb00688.x