Noncentral t-distribution

Last updated
Noncentral Student's t
Probability density function
Nc student t pdf.svg
Parameters ν > 0 degrees of freedom
noncentrality parameter
Support
PDF see text
CDF see text
Mean see text
Mode see text
Variance see text
Skewness see text
Ex. kurtosis see text

The noncentral t-distribution generalizes Student's t-distribution using a noncentrality parameter. Whereas the central probability distribution describes how a test statistic t is distributed when the difference tested is null, the noncentral distribution describes how t is distributed when the null is false. This leads to its use in statistics, especially calculating statistical power. The noncentral t-distribution is also known as the singly noncentral t-distribution, and in addition to its primary use in statistical inference, is also used in robust modeling for data.

Contents

Definitions

If Z is a standard normal random variable, and V is a chi-squared distributed random variable with ν degrees of freedom that is independent of Z, then

is a noncentral t-distributed random variable with ν degrees of freedom and noncentrality parameter μ ≠ 0. Note that the noncentrality parameter may be negative.

Cumulative distribution function

The cumulative distribution function of noncentral t-distribution with ν degrees of freedom and noncentrality parameter μ can be expressed as [1]

where

is the regularized incomplete beta function,

and Φ is the cumulative distribution function of the standard normal distribution.

Alternatively, the noncentral t-distribution CDF can be expressed as[ citation needed ]:

where Γ is the gamma function and I is the regularized incomplete beta function.

Although there are other forms of the cumulative distribution function, the first form presented above is very easy to evaluate through recursive computing. [1] In statistical software R, the cumulative distribution function is implemented as pt.

Probability density function

The probability density function (pdf) for the noncentral t-distribution with ν > 0 degrees of freedom and noncentrality parameter μ can be expressed in several forms.

The confluent hypergeometric function form of the density function is

where

and where 1F1 is a confluent hypergeometric function.

An alternative integral form is [2]

A third form of the density is obtained using its cumulative distribution functions, as follows.

This is the approach implemented by the dt function in R.

Properties

Moments of the noncentral t-distribution

In general, the kth raw moment of the noncentral t-distribution is [3]

In particular, the mean and variance of the noncentral t-distribution are

An excellent approximation to is , which can be used in both formulas. [4] [5]

Asymmetry

The non-central t-distribution is asymmetric unless μ is zero, i.e., a central t-distribution. In addition, the asymmetry becomes smaller the larger degree of freedom. The right tail will be heavier than the left when μ > 0, and vice versa. However, the usual skewness is not generally a good measure of asymmetry for this distribution, because if the degrees of freedom is not larger than 3, the third moment does not exist at all. Even if the degrees of freedom is greater than 3, the sample estimate of the skewness is still very unstable unless the sample size is very large.


Mode

The noncentral t-distribution is always unimodal and bell shaped, but the mode is not analytically available, although for μ 0 we have [6]

In particular, the mode always has the same sign as the noncentrality parameter μ. Moreover, the negative of the mode is exactly the mode for a noncentral t-distribution with the same number of degrees of freedom ν but noncentrality parameter −μ.

The mode is strictly increasing with μ (it always moves in the same direction as μ is adjusted in). In the limit, when μ → 0, the mode is approximated by

and when μ → ∞, the mode is approximated by

Special cases

Occurrence and applications

Use in power analysis

Suppose we have an independent and identically distributed sample X1, ..., Xn each of which is normally distributed with mean θ and variance σ2, and we are interested in testing the null hypothesis θ = 0 vs. the alternative hypothesis θ ≠ 0. We can perform a one sample t-test using the test statistic

where is the sample mean and is the unbiased sample variance. Since the right hand side of the second equality exactly matches the characterization of a noncentral t-distribution as described above, T has a noncentral t-distribution with n−1 degrees of freedom and noncentrality parameter .

If the test procedure rejects the null hypothesis whenever , where is the upper α/2 quantile of the (central) Student's t-distribution for a pre-specified α ∈ (0, 1), then the power of this test is given by

Similar applications of the noncentral t-distribution can be found in the power analysis of the general normal-theory linear models, which includes the above one sample t-test as a special case.

Use in tolerance intervals

One-sided normal tolerance intervals have an exact solution in terms of the sample mean and sample variance based on the noncentral t-distribution. [8] This enables the calculation of a statistical interval within which, with some confidence level, a specified proportion of a sampled population falls.

See also

Related Research Articles

<span class="mw-page-title-main">Normal distribution</span> Probability distribution

In statistics, a normal distribution or Gaussian distribution is a type of continuous probability distribution for a real-valued random variable. The general form of its probability density function is

In particle physics, the Dirac equation is a relativistic wave equation derived by British physicist Paul Dirac in 1928. In its free form, or including electromagnetic interactions, it describes all spin-12 massive particles, called "Dirac particles", such as electrons and quarks for which parity is a symmetry. It is consistent with both the principles of quantum mechanics and the theory of special relativity, and was the first theory to account fully for special relativity in the context of quantum mechanics. It was validated by accounting for the fine structure of the hydrogen spectrum in a completely rigorous way.

Students <i>t</i>-distribution Probability distribution

In probability and statistics, Student's t-distribution is a continuous probability distribution that generalizes the standard normal distribution. Like the latter, it is symmetric around zero and bell-shaped.

<span class="mw-page-title-main">Chi-squared distribution</span> Probability distribution and special case of gamma distribution

In probability theory and statistics, the chi-squared distribution with degrees of freedom is the distribution of a sum of the squares of independent standard normal random variables. The chi-squared distribution is a special case of the gamma distribution and is one of the most widely used probability distributions in inferential statistics, notably in hypothesis testing and in construction of confidence intervals. This distribution is sometimes called the central chi-squared distribution, a special case of the more general noncentral chi-squared distribution.

<span class="mw-page-title-main">Scaled inverse chi-squared distribution</span> Probability distribution

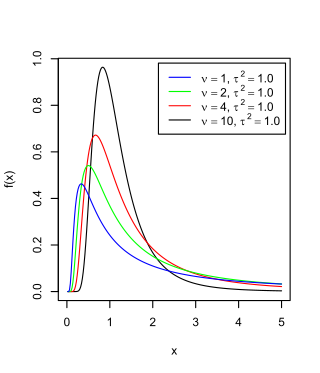
The scaled inverse chi-squared distribution is the distribution for x = 1/s2, where s2 is a sample mean of the squares of ν independent normal random variables that have mean 0 and inverse variance 1/σ2 = τ2. The distribution is therefore parametrised by the two quantities ν and τ2, referred to as the number of chi-squared degrees of freedom and the scaling parameter, respectively.

<span class="mw-page-title-main">Pearson distribution</span> Family of continuous probability distributions

The Pearson distribution is a family of continuous probability distributions. It was first published by Karl Pearson in 1895 and subsequently extended by him in 1901 and 1916 in a series of articles on biostatistics.

<span class="mw-page-title-main">Rice distribution</span> Probability distribution

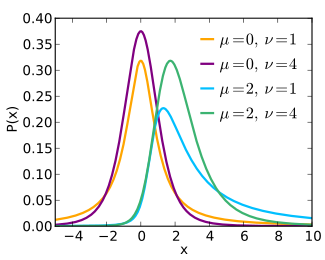
In probability theory, the Rice distribution or Rician distribution is the probability distribution of the magnitude of a circularly-symmetric bivariate normal random variable, possibly with non-zero mean (noncentral). It was named after Stephen O. Rice (1907–1986).

<span class="mw-page-title-main">Noncentral chi-squared distribution</span> Noncentral generalization of the chi-squared distribution

In probability theory and statistics, the noncentral chi-squared distribution is a noncentral generalization of the chi-squared distribution. It often arises in the power analysis of statistical tests in which the null distribution is a chi-squared distribution; important examples of such tests are the likelihood-ratio tests.

In probability theory and statistics, the noncentral chi distribution is a noncentral generalization of the chi distribution. It is also known as the generalized Rayleigh distribution.

<span class="mw-page-title-main">Maxwell's equations in curved spacetime</span> Electromagnetism in general relativity

In physics, Maxwell's equations in curved spacetime govern the dynamics of the electromagnetic field in curved spacetime or where one uses an arbitrary coordinate system. These equations can be viewed as a generalization of the vacuum Maxwell's equations which are normally formulated in the local coordinates of flat spacetime. But because general relativity dictates that the presence of electromagnetic fields induce curvature in spacetime, Maxwell's equations in flat spacetime should be viewed as a convenient approximation.

<span class="mw-page-title-main">Folded normal distribution</span> Probability distribution

The folded normal distribution is a probability distribution related to the normal distribution. Given a normally distributed random variable X with mean μ and variance σ2, the random variable Y = |X| has a folded normal distribution. Such a case may be encountered if only the magnitude of some variable is recorded, but not its sign. The distribution is called "folded" because probability mass to the left of x = 0 is folded over by taking the absolute value. In the physics of heat conduction, the folded normal distribution is a fundamental solution of the heat equation on the half space; it corresponds to having a perfect insulator on a hyperplane through the origin.

In statistics, the multivariate t-distribution is a multivariate probability distribution. It is a generalization to random vectors of the Student's t-distribution, which is a distribution applicable to univariate random variables. While the case of a random matrix could be treated within this structure, the matrix t-distribution is distinct and makes particular use of the matrix structure.

Expected shortfall (ES) is a risk measure—a concept used in the field of financial risk measurement to evaluate the market risk or credit risk of a portfolio. The "expected shortfall at q% level" is the expected return on the portfolio in the worst of cases. ES is an alternative to value at risk that is more sensitive to the shape of the tail of the loss distribution.

In financial mathematics, tail value at risk (TVaR), also known as tail conditional expectation (TCE) or conditional tail expectation (CTE), is a risk measure associated with the more general value at risk. It quantifies the expected value of the loss given that an event outside a given probability level has occurred.

<span class="mw-page-title-main">Normal-inverse-gamma distribution</span>

In probability theory and statistics, the normal-inverse-gamma distribution is a four-parameter family of multivariate continuous probability distributions. It is the conjugate prior of a normal distribution with unknown mean and variance.

In probability and statistics, the generalized K-distribution is a three-parameter family of continuous probability distributions. The distribution arises by compounding two gamma distributions. In each case, a re-parametrization of the usual form of the family of gamma distributions is used, such that the parameters are:

In statistics and probability theory, the nonparametric skew is a statistic occasionally used with random variables that take real values. It is a measure of the skewness of a random variable's distribution—that is, the distribution's tendency to "lean" to one side or the other of the mean. Its calculation does not require any knowledge of the form of the underlying distribution—hence the name nonparametric. It has some desirable properties: it is zero for any symmetric distribution; it is unaffected by a scale shift; and it reveals either left- or right-skewness equally well. In some statistical samples it has been shown to be less powerful than the usual measures of skewness in detecting departures of the population from normality.

In probability theory and statistics, the generalized multivariate log-gamma (G-MVLG) distribution is a multivariate distribution introduced by Demirhan and Hamurkaroglu in 2011. The G-MVLG is a flexible distribution. Skewness and kurtosis are well controlled by the parameters of the distribution. This enables one to control dispersion of the distribution. Because of this property, the distribution is effectively used as a joint prior distribution in Bayesian analysis, especially when the likelihood is not from the location-scale family of distributions such as normal distribution.

In statistics, the folded-t and half-t distributions are derived from Student's t-distribution by taking the absolute values of variates. This is analogous to the folded-normal and the half-normal statistical distributions being derived from the normal distribution.

<span class="mw-page-title-main">Stable count distribution</span> Probability distribution

In probability theory, the stable count distribution is the conjugate prior of a one-sided stable distribution. This distribution was discovered by Stephen Lihn in his 2017 study of daily distributions of the S&P 500 and the VIX. The stable distribution family is also sometimes referred to as the Lévy alpha-stable distribution, after Paul Lévy, the first mathematician to have studied it.

References

  1. 1 2 Lenth, Russell V (1989). "Algorithm AS 243: Cumulative Distribution Function of the Non-central t Distribution". Journal of the Royal Statistical Society, Series C. 38 (1): 185–189. JSTOR   2347693.
  2. L. Scharf, Statistical Signal Processing, (Massachusetts: Addison-Wesley, 1991), p.177.
  3. Hogben, D; Pinkham, RS; Wilk, MB (1961). "The moments of the non-central t-distribution". Biometrika. 48 (3–4): 465–468. doi:10.1093/biomet/48.3-4.465. hdl: 2027/coo.31924001119068 . JSTOR   2332772.
  4. Hedges, Larry V. (June 1981). "Distribution Theory for Glass's Estimator of Effect size and Related Estimators". Journal of Educational Statistics. 6 (2): 107–128. doi:10.3102/2F10769986006002107.
  5. Tothfalusi, Laszlo; Endrenyi, Laszlo (1 March 2016). "An Exact Procedure for the Evaluation of Reference-Scaled Average Bioequivalence". The AAPS Journal. 18 (2): 476–489. doi: 10.1208/s12248-016-9873-6 .
  6. van Aubel, A; Gawronski, W (2003). "Analytic properties of noncentral distributions". Applied Mathematics and Computation. 141: 3–12. doi:10.1016/S0096-3003(02)00316-8.
  7. Helena Chmura Kraemer; Minja Paik (1979). "A Central t Approximation to the Noncentral t Distribution". Technometrics. 21 (3): 357–360. doi:10.1080/00401706.1979.10489781. JSTOR   1267759.
  8. Derek S. Young (August 2010). "tolerance: An R Package for Estimating Tolerance Intervals". Journal of Statistical Software. 36 (5): 1–39. ISSN   1548-7660 . Retrieved 19 February 2013., p.23