Parabolic fractal distribution

Last updated

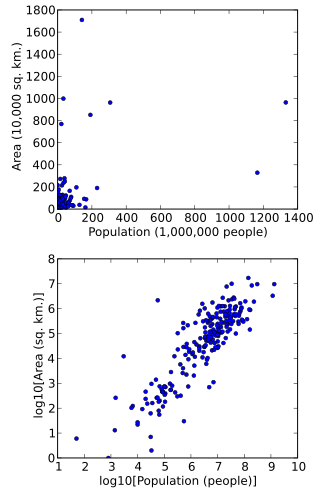
In probability and statistics, the parabolic fractal distribution is a type of discrete probability distribution in which the logarithm of the frequency or size of entities in a population is a quadratic polynomial of the logarithm of the rank (with the largest example having rank 1). This can markedly improve the fit over a simple power-law relationship (see references below).

Contents

In the Laherrère/Deheuvels paper below, examples include galaxy sizes (ordered by luminosity), towns (in the USA, France, and world), spoken languages (by number of speakers) in the world, and oil fields in the world (by size). They also mention utility for this distribution in fitting seismic events (no example). The authors assert the advantage of this distribution is that it can be fitted using the largest known examples of the population being modeled, which are often readily available and complete, then the fitted parameters found can be used to compute the size of the entire population. So, for example, the populations of the hundred largest cities on the planet can be sorted and fitted, and the parameters found used to extrapolate to the smallest villages, to estimate the population of the planet. Another example is estimating total world oil reserves using the largest fields.

In a number of applications, there is a so-called King effect where the top-ranked item(s) have a significantly greater frequency or size than the model predicts on the basis of the other items. The Laherrère/Deheuvels paper shows the example of Paris, when sorting the sizes of towns in France. When the paper was written Paris was the largest city with about ten million inhabitants, but the next largest town had only about 1.5 million. Towns in France excluding Paris closely follow a parabolic distribution, well enough that the 56 largest gave a very good estimate of the population of the country. But that distribution would predict the largest city to have about two million inhabitants, not 10 million. The King Effect is named after the notion that a King must defeat all rivals for the throne and takes their wealth, estates and power, thereby creating a buffer between himself and the next-richest of his subjects. That specific effect (intentionally created) may apply to corporate sizes, where the largest businesses use their wealth to buy up smaller rivals. Absent intent, the King Effect may occur as a result of some persistent growth advantage due to scale, or to some unique advantage. Larger cities are more efficient connectors of people, talent and other resources. Unique advantages might include being a port city, or a Capital city where law is made, or a center of activity where physical proximity increases opportunity and creates a feedback loop. An example is the motion picture industry; where actors, writers and other workers move to where the most studios are, and new studios are founded in the same place because that is where the most talent resides.

To test for the King Effect, the distribution must be fitted excluding the 'k' top-ranked items, but without assigning new rank numbers to the remaining members of the population. For example, in France the ranks are (as of 2010):

  1. Paris, 12.09M
  2. Lyon, 2.12M
  3. Marseille, 1.72M
  4. Toulouse, 1.20M
  5. Lille, 1.15M

A fitting algorithm would process pairs {(1,12.09), (2,2.12), (3,1.72), (4,1.20), (5,1.15)} and find the parameters for the best parabolic fit through those points. To test for the King Effect we just exclude the first pair (or first 'k' pairs), and find parabolic parameters that fit the remainder of the points. So for France we would fit the four points {(2,2.12), (3,1.72), (4,1.20), (5,1.15)}. Then we can use those parameters to estimate the size of cities ranked [1,k] and determine if they are King Effect members or normal members.

By comparison, Zipf's law fits a line through the points (also using the log of the rank and log of the value). A parabola (with one more parameter) will fit better, but far from the vertex the parabola is also nearly linear. Thus, although it is a judgment call for the statistician, if the fitted parameters put the vertex far from the points fitted, or if the parabolic curve is not a significantly better fit than a line, those may be symptomatic of overfitting (aka over-parameterization). The line (with two parameters instead of three) is probably the better generalization. More parameters always fit better, but at the cost of adding unexplained parameters or unwarranted assumptions (such as the assumption that a slight parabolic curve is a more appropriate model than a line).

Alternatively, it is possible to force the fitted parabola to have its vertex at the rank 1 position. In that case, it is not certain the parabola will fit better (have less error) than a straight line; and the choice might be made between the two based on which has the least error.

Definition

The probability mass function is given, as a function of the rank n, by

where b and c are parameters of the distribution.

See also

Related Research Articles

<span class="mw-page-title-main">Parabola</span> Plane curve: conic section

In mathematics, a parabola is a plane curve which is mirror-symmetrical and is approximately U-shaped. It fits several superficially different mathematical descriptions, which can all be proved to define exactly the same curves.

<span class="mw-page-title-main">Power law</span> Functional relationship between two quantities

In statistics, a power law is a functional relationship between two quantities, where a relative change in one quantity results in a proportional relative change in the other quantity, independent of the initial size of those quantities: one quantity varies as a power of another. For instance, considering the area of a square in terms of the length of its side, if the length is doubled, the area is multiplied by a factor of four.

<span class="mw-page-title-main">Zipf's law</span> Probability distribution

Zipf's law is an empirical law formulated using mathematical statistics that refers to the fact that for many types of data studied in the physical and social sciences, the rank-frequency distribution is an inverse relation. The Zipfian distribution is one of a family of related discrete power law probability distributions. It is related to the zeta distribution, but is not identical.

<span class="mw-page-title-main">Pareto distribution</span> Probability distribution

The Pareto distribution, named after the Italian civil engineer, economist, and sociologist Vilfredo Pareto, is a power-law probability distribution that is used in description of social, quality control, scientific, geophysical, actuarial, and many other types of observable phenomena; the principle originally applied to describing the distribution of wealth in a society, fitting the trend that a large portion of wealth is held by a small fraction of the population. The Pareto principle or "80-20 rule" stating that 80% of outcomes are due to 20% of causes was named in honour of Pareto, but the concepts are distinct, and only Pareto distributions with shape value of log45 ≈ 1.16 precisely reflect it. Empirical observation has shown that this 80-20 distribution fits a wide range of cases, including natural phenomena and human activities.

<span class="mw-page-title-main">Weibull distribution</span> Continuous probability distribution

In probability theory and statistics, the Weibull distribution is a continuous probability distribution. It is named after Swedish mathematician Waloddi Weibull, who described it in detail in 1951, although it was first identified by Maurice René Fréchet and first applied by Rosin & Rammler (1933) to describe a particle size distribution.

An F-test is any statistical test in which the test statistic has an F-distribution under the null hypothesis. It is most often used when comparing statistical models that have been fitted to a data set, in order to identify the model that best fits the population from which the data were sampled. Exact "F-tests" mainly arise when the models have been fitted to the data using least squares. The name was coined by George W. Snedecor, in honour of Ronald Fisher. Fisher initially developed the statistic as the variance ratio in the 1920s.

In probability theory and statistics, the Zipf–Mandelbrot law is a discrete probability distribution. Also known as the Pareto–Zipf law, it is a power-law distribution on ranked data, named after the linguist George Kingsley Zipf who suggested a simpler distribution called Zipf's law, and the mathematician Benoit Mandelbrot, who subsequently generalized it.

<span class="mw-page-title-main">Curve fitting</span> Process of constructing a curve that has the best fit to a series of data points

Curve fitting is the process of constructing a curve, or mathematical function, that has the best fit to a series of data points, possibly subject to constraints. Curve fitting can involve either interpolation, where an exact fit to the data is required, or smoothing, in which a "smooth" function is constructed that approximately fits the data. A related topic is regression analysis, which focuses more on questions of statistical inference such as how much uncertainty is present in a curve that is fit to data observed with random errors. Fitted curves can be used as an aid for data visualization, to infer values of a function where no data are available, and to summarize the relationships among two or more variables. Extrapolation refers to the use of a fitted curve beyond the range of the observed data, and is subject to a degree of uncertainty since it may reflect the method used to construct the curve as much as it reflects the observed data.

The Akaike information criterion (AIC) is an estimator of prediction error and thereby relative quality of statistical models for a given set of data. Given a collection of models for the data, AIC estimates the quality of each model, relative to each of the other models. Thus, AIC provides a means for model selection.

Random sample consensus (RANSAC) is an iterative method to estimate parameters of a mathematical model from a set of observed data that contains outliers, when outliers are to be accorded no influence on the values of the estimates. Therefore, it also can be interpreted as an outlier detection method. It is a non-deterministic algorithm in the sense that it produces a reasonable result only with a certain probability, with this probability increasing as more iterations are allowed. The algorithm was first published by Fischler and Bolles at SRI International in 1981. They used RANSAC to solve the Location Determination Problem (LDP), where the goal is to determine the points in the space that project onto an image into a set of landmarks with known locations.

Gibrat's law, sometimes called Gibrat's rule of proportionate growth or the law of proportionate effect, is a rule defined by Robert Gibrat (1904–1980) in 1931 stating that the proportional rate of growth of a firm is independent of its absolute size. The law of proportionate growth gives rise to a firm size distribution that is log-normal.

This glossary of statistics and probability is a list of definitions of terms and concepts used in the mathematical sciences of statistics and probability, their sub-disciplines, and related fields. For additional related terms, see Glossary of mathematics and Glossary of experimental design.

<span class="mw-page-title-main">Giant component</span> Large connected component of a random graph

In network theory, a giant component is a connected component of a given random graph that contains a finite fraction of the entire graph's vertices.

<span class="mw-page-title-main">Chaos game</span>

In mathematics, the term chaos game originally referred to a method of creating a fractal, using a polygon and an initial point selected at random inside it. The fractal is created by iteratively creating a sequence of points, starting with the initial random point, in which each point in the sequence is a given fraction of the distance between the previous point and one of the vertices of the polygon; the vertex is chosen at random in each iteration. Repeating this iterative process a large number of times, selecting the vertex at random on each iteration, and throwing out the first few points in the sequence, will often produce a fractal shape. Using a regular triangle and the factor 1/2 will result in the Sierpinski triangle, while creating the proper arrangement with four points and a factor 1/2 will create a display of a "Sierpinski Tetrahedron", the three-dimensional analogue of the Sierpinski triangle. As the number of points is increased to a number N, the arrangement forms a corresponding (N-1)-dimensional Sierpinski Simplex.

<span class="mw-page-title-main">Data transformation (statistics)</span>

In statistics, data transformation is the application of a deterministic mathematical function to each point in a data set—that is, each data point zi is replaced with the transformed value yi = f(zi), where f is a function. Transforms are usually applied so that the data appear to more closely meet the assumptions of a statistical inference procedure that is to be applied, or to improve the interpretability or appearance of graphs.

<span class="mw-page-title-main">Rank–size distribution</span>

Rank–size distribution is the distribution of size by rank, in decreasing order of size. For example, if a data set consists of items of sizes 5, 100, 5, and 8, the rank-size distribution is 100, 8, 5, 5. This is also known as the rank–frequency distribution, when the source data are from a frequency distribution. These are particularly of interest when the data vary significantly in scales, such as city size or word frequency. These distributions frequently follow a power law distribution, or less well-known ones such as a stretched exponential function or parabolic fractal distribution, at least approximately for certain ranges of ranks; see below.

The survival function is a function that gives the probability that a patient, device, or other object of interest will survive past a certain time.

<span class="mw-page-title-main">King effect</span> Phenomenon in statistics where highest-ranked data points are outliers

In statistics, economics, and econophysics, the king effect is the phenomenon in which the top one or two members of a ranked set show up as clear outliers. These top one or two members are unexpectedly large because they do not conform to the statistical distribution or rank-distribution which the remainder of the set obeys.

In statistics, the class of vector generalized linear models (VGLMs) was proposed to enlarge the scope of models catered for by generalized linear models (GLMs). In particular, VGLMs allow for response variables outside the classical exponential family and for more than one parameter. Each parameter can be transformed by a link function. The VGLM framework is also large enough to naturally accommodate multiple responses; these are several independent responses each coming from a particular statistical distribution with possibly different parameter values.

References