Directional statistics

Last updated

Directional statistics (also circular statistics or spherical statistics) is the subdiscipline of statistics that deals with directions (unit vectors in Euclidean space, Rn), axes (lines through the origin in Rn) or rotations in Rn. More generally, directional statistics deals with observations on compact Riemannian manifolds including the Stiefel manifold.

Contents

The overall shape of a protein can be parameterized as a sequence of points on the unit sphere. Shown are two views of the spherical histogram of such points for a large collection of protein structures. The statistical treatment of such data is in the realm of directional statistics. Fb5 cover.jpg
The overall shape of a protein can be parameterized as a sequence of points on the unit sphere. Shown are two views of the spherical histogram of such points for a large collection of protein structures. The statistical treatment of such data is in the realm of directional statistics.

The fact that 0 degrees and 360 degrees are identical angles, so that for example 180 degrees is not a sensible mean of 2 degrees and 358 degrees, provides one illustration that special statistical methods are required for the analysis of some types of data (in this case, angular data). Other examples of data that may be regarded as directional include statistics involving temporal periods (e.g. time of day, week, month, year, etc.), compass directions, dihedral angles in molecules, orientations, rotations and so on.

Circular distributions

Any probability density function (pdf) on the line can be "wrapped" around the circumference of a circle of unit radius. [2] That is, the pdf of the wrapped variable

is

This concept can be extended to the multivariate context by an extension of the simple sum to a number of sums that cover all dimensions in the feature space:

where is the -th Euclidean basis vector.

The following sections show some relevant circular distributions.

von Mises circular distribution

The von Mises distribution is a circular distribution which, like any other circular distribution, may be thought of as a wrapping of a certain linear probability distribution around the circle. The underlying linear probability distribution for the von Mises distribution is mathematically intractable; however, for statistical purposes, there is no need to deal with the underlying linear distribution. The usefulness of the von Mises distribution is twofold: it is the most mathematically tractable of all circular distributions, allowing simpler statistical analysis, and it is a close approximation to the wrapped normal distribution, which, analogously to the linear normal distribution, is important because it is the limiting case for the sum of a large number of small angular deviations. In fact, the von Mises distribution is often known as the "circular normal" distribution because of its ease of use and its close relationship to the wrapped normal distribution (Fisher, 1993).

The pdf of the von Mises distribution is:

where is the modified Bessel function of order 0.

Circular uniform distribution

The probability density function (pdf) of the circular uniform distribution is given by

It can also be thought of as of the von Mises above.

Wrapped normal distribution

The pdf of the wrapped normal distribution (WN) is:

where μ and σ are the mean and standard deviation of the unwrapped distribution, respectively and is the Jacobi theta function:

where and

Wrapped Cauchy distribution

The pdf of the wrapped Cauchy distribution (WC) is:

where is the scale factor and is the peak position.

Wrapped Lévy distribution

The pdf of the wrapped Lévy distribution (WL) is:

where the value of the summand is taken to be zero when , is the scale factor and is the location parameter.

Projected normal distribution

The projected normal distribution is a circular distribution representing the direction of a random variable with multivariate normal distribution, obtained by radial projection of the variable over the unit (n-1)-sphere. Due to this, and unlike other commonly used circular distributions, it is not symmetric nor unimodal.

Distributions on higher-dimensional manifolds

Three points sets sampled from different Kent distributions on the sphere. Point sets from Kent distributions mapped onto a sphere - journal.pcbi.0020131.g004.svg
Three points sets sampled from different Kent distributions on the sphere.

There also exist distributions on the two-dimensional sphere (such as the Kent distribution [3] ), the N-dimensional sphere (the von Mises–Fisher distribution [4] ) or the torus (the bivariate von Mises distribution [5] ).

The matrix von Mises–Fisher distribution [6] is a distribution on the Stiefel manifold, and can be used to construct probability distributions over rotation matrices. [7]

The Bingham distribution is a distribution over axes in N dimensions, or equivalently, over points on the (N  1)-dimensional sphere with the antipodes identified. [8] For example, if N = 2, the axes are undirected lines through the origin in the plane. In this case, each axis cuts the unit circle in the plane (which is the one-dimensional sphere) at two points that are each other's antipodes. For N = 4, the Bingham distribution is a distribution over the space of unit quaternions (versors). Since a versor corresponds to a rotation matrix, the Bingham distribution for N = 4 can be used to construct probability distributions over the space of rotations, just like the Matrix-von Mises–Fisher distribution.

These distributions are for example used in geology, [9] crystallography [10] and bioinformatics. [1] [11] [12]

Moments

The raw vector (or trigonometric) moments of a circular distribution are defined as

where is any interval of length , is the PDF of the circular distribution, and . Since the integral is unity, and the integration interval is finite, it follows that the moments of any circular distribution are always finite and well defined.

Sample moments are analogously defined:

The population resultant vector, length, and mean angle are defined in analogy with the corresponding sample parameters.

In addition, the lengths of the higher moments are defined as:

while the angular parts of the higher moments are just . The lengths of all moments will lie between 0 and 1.

Measures of location and spread

Various measures of central tendency and statistical dispersion may be defined for both the population and a sample drawn from that population. [13]

Central tendency

The most common measure of location is the circular mean. The population circular mean is simply the first moment of the distribution while the sample mean is the first moment of the sample. The sample mean will serve as an unbiased estimator of the population mean.

When data is concentrated, the median and mode may be defined by analogy to the linear case, but for more dispersed or multi-modal data, these concepts are not useful.

Dispersion

The most common measures of circular spread are:

Distribution of the mean

Given a set of N measurements the mean value of z is defined as:

which may be expressed as

where

or, alternatively as:

where

The distribution of the mean angle () for a circular pdf P(θ) will be given by:

where is over any interval of length and the integral is subject to the constraint that and are constant, or, alternatively, that and are constant.

The calculation of the distribution of the mean for most circular distributions is not analytically possible, and in order to carry out an analysis of variance, numerical or mathematical approximations are needed. [14]

The central limit theorem may be applied to the distribution of the sample means. (main article: Central limit theorem for directional statistics). It can be shown [14] that the distribution of approaches a bivariate normal distribution in the limit of large sample size.

Goodness of fit and significance testing

For cyclic data – (e.g., is it uniformly distributed) :

See also

Related Research Articles

<span class="mw-page-title-main">Theta function</span> Special functions of several complex variables

In mathematics, theta functions are special functions of several complex variables. They show up in many topics, including Abelian varieties, moduli spaces, quadratic forms, and solitons. As Grassmann algebras, they appear in quantum field theory.

<span class="mw-page-title-main">Stable distribution</span> Distribution of variables which satisfies a stability property under linear combinations

In probability theory, a distribution is said to be stable if a linear combination of two independent random variables with this distribution has the same distribution, up to location and scale parameters. A random variable is said to be stable if its distribution is stable. The stable distribution family is also sometimes referred to as the Lévy alpha-stable distribution, after Paul Lévy, the first mathematician to have studied it.

In probability and statistics, a circular distribution or polar distribution is a probability distribution of a random variable whose values are angles, usually taken to be in the range [0, 2π). A circular distribution is often a continuous probability distribution, and hence has a probability density, but such distributions can also be discrete, in which case they are called circular lattice distributions. Circular distributions can be used even when the variables concerned are not explicitly angles: the main consideration is that there is not usually any real distinction between events occurring at the lower or upper end of the range, and the division of the range could notionally be made at any point.
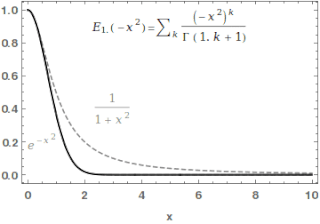
von Mises distribution Probability distribution on the circle

In probability theory and directional statistics, the von Mises distribution is a continuous probability distribution on the circle. It is a close approximation to the wrapped normal distribution, which is the circular analogue of the normal distribution. A freely diffusing angle on a circle is a wrapped normally distributed random variable with an unwrapped variance that grows linearly in time. On the other hand, the von Mises distribution is the stationary distribution of a drift and diffusion process on the circle in a harmonic potential, i.e. with a preferred orientation. The von Mises distribution is the maximum entropy distribution for circular data when the real and imaginary parts of the first circular moment are specified. The von Mises distribution is a special case of the von Mises–Fisher distribution on the N-dimensional sphere.

<span class="mw-page-title-main">Rice distribution</span> Probability distribution

In probability theory, the Rice distribution or Rician distribution is the probability distribution of the magnitude of a circularly-symmetric bivariate normal random variable, possibly with non-zero mean (noncentral). It was named after Stephen O. Rice (1907–1986).

A ratio distribution is a probability distribution constructed as the distribution of the ratio of random variables having two other known distributions. Given two random variables X and Y, the distribution of the random variable Z that is formed as the ratio Z = X/Y is a ratio distribution.

In the mathematical theory of conformal mappings, the area theorem gives an inequality satisfied by the power series coefficients of certain conformal mappings. The theorem is called by that name, not because of its implications, but rather because the proof uses the notion of area.

In mathematics, Maass forms or Maass wave forms are studied in the theory of automorphic forms. Maass forms are complex-valued smooth functions of the upper half plane, which transform in a similar way under the operation of a discrete subgroup of as modular forms. They are eigenforms of the hyperbolic Laplace operator defined on and satisfy certain growth conditions at the cusps of a fundamental domain of . In contrast to modular forms, Maass forms need not be holomorphic. They were studied first by Hans Maass in 1949.

In mathematics, the Parseval–Gutzmer formula states that, if is an analytic function on a closed disk of radius r with Taylor series

<span class="mw-page-title-main">Wrapped normal distribution</span>

In probability theory and directional statistics, a wrapped normal distribution is a wrapped probability distribution that results from the "wrapping" of the normal distribution around the unit circle. It finds application in the theory of Brownian motion and is a solution to the heat equation for periodic boundary conditions. It is closely approximated by the von Mises distribution, which, due to its mathematical simplicity and tractability, is the most commonly used distribution in directional statistics.

In probability theory, the family of complex normal distributions, denoted or , characterizes complex random variables whose real and imaginary parts are jointly normal. The complex normal family has three parameters: location parameter μ, covariance matrix , and the relation matrix . The standard complex normal is the univariate distribution with , , and .

In probability theory and directional statistics, a wrapped probability distribution is a continuous probability distribution that describes data points that lie on a unit n-sphere. In one dimension, a wrapped distribution consists of points on the unit circle. If is a random variate in the interval with probability density function (PDF) , then is a circular variable distributed according to the wrapped distribution and is an angular variable in the interval distributed according to the wrapped distribution .

<span class="mw-page-title-main">Wrapped Cauchy distribution</span>

In probability theory and directional statistics, a wrapped Cauchy distribution is a wrapped probability distribution that results from the "wrapping" of the Cauchy distribution around the unit circle. The Cauchy distribution is sometimes known as a Lorentzian distribution, and the wrapped Cauchy distribution may sometimes be referred to as a wrapped Lorentzian distribution.

In probability theory and directional statistics, a circular uniform distribution is a probability distribution on the unit circle whose density is uniform for all angles.

In probability theory and directional statistics, a wrapped Lévy distribution is a wrapped probability distribution that results from the "wrapping" of the Lévy distribution around the unit circle.

A product distribution is a probability distribution constructed as the distribution of the product of random variables having two other known distributions. Given two statistically independent random variables X and Y, the distribution of the random variable Z that is formed as the product is a product distribution.

<span class="mw-page-title-main">Wrapped exponential distribution</span> Probability distribution

In probability theory and directional statistics, a wrapped exponential distribution is a wrapped probability distribution that results from the "wrapping" of the exponential distribution around the unit circle.

In the field of computer vision, velocity moments are weighted averages of the intensities of pixels in a sequence of images, similar to image moments but in addition to describing an object's shape also describe its motion through the sequence of images. Velocity moments can be used to aid automated identification of a shape in an image when information about the motion is significant in its description. There are currently two established versions of velocity moments: Cartesian and Zernike.

In representation theory of mathematics, the Waldspurger formula relates the special values of two L-functions of two related admissible irreducible representations. Let k be the base field, f be an automorphic form over k, π be the representation associated via the Jacquet–Langlands correspondence with f. Goro Shimura (1976) proved this formula, when and f is a cusp form; Günter Harder made the same discovery at the same time in an unpublished paper. Marie-France Vignéras (1980) proved this formula, when and f is a newform. Jean-Loup Waldspurger, for whom the formula is named, reproved and generalized the result of Vignéras in 1985 via a totally different method which was widely used thereafter by mathematicians to prove similar formulas.

<span class="mw-page-title-main">Stable count distribution</span> Probability distribution

In probability theory, the stable count distribution is the conjugate prior of a one-sided stable distribution. This distribution was discovered by Stephen Lihn in his 2017 study of daily distributions of the S&P 500 and the VIX. The stable distribution family is also sometimes referred to as the Lévy alpha-stable distribution, after Paul Lévy, the first mathematician to have studied it.

References

  1. 1 2 Hamelryck, Thomas; Kent, John T.; Krogh, Anders (2006). "Hamelryck, T., Kent, J., Krogh, A. (2006) Sampling realistic protein conformations using local structural bias. PLoS Comput. Biol., 2(9): e131". PLOS Computational Biology. 2 (9): e131. Bibcode:2006PLSCB...2..131H. doi: 10.1371/journal.pcbi.0020131 . PMC   1570370 . PMID   17002495.
  2. Bahlmann, C., (2006), Directional features in online handwriting recognition, Pattern Recognition, 39
  3. Kent, J (1982) The Fisher–Bingham distribution on the sphere. J Royal Stat Soc, 44, 71–80.
  4. Fisher, RA (1953) Dispersion on a sphere. Proc. Roy. Soc. London Ser. A., 217, 295–305
  5. Mardia, KM. Taylor; CC; Subramaniam, GK. (2007). "Protein Bioinformatics and Mixtures of Bivariate von Mises Distributions for Angular Data". Biometrics. 63 (2): 505–512. doi:10.1111/j.1541-0420.2006.00682.x. PMID   17688502. S2CID   14293602.
  6. Pal, Subhadip; Sengupta, Subhajit; Mitra, Riten; Banerjee, Arunava (September 2020). "Conjugate Priors and Posterior Inference for the Matrix Langevin Distribution on the Stiefel Manifold". Bayesian Analysis. 15 (3): 871–908. doi: 10.1214/19-BA1176 . ISSN   1936-0975. S2CID   209974627.
  7. Downs (1972). "Orientational statistics". Biometrika. 59 (3): 665–676. doi:10.1093/biomet/59.3.665.
  8. Bingham, C. (1974). "An Antipodally Symmetric Distribution on the Sphere". Ann. Stat. 2 (6): 1201–1225. doi: 10.1214/aos/1176342874 .
  9. Peel, D.; Whiten, WJ.; McLachlan, GJ. (2001). "Fitting mixtures of Kent distributions to aid in joint set identification" (PDF). J. Am. Stat. Assoc. 96 (453): 56–63. doi:10.1198/016214501750332974. S2CID   11667311.
  10. Krieger Lassen, N. C.; Juul Jensen, D.; Conradsen, K. (1994). "On the statistical analysis of orientation data". Acta Crystallogr. A50 (6): 741–748. doi:10.1107/S010876739400437X.
  11. Kent, J.T., Hamelryck, T. (2005). Using the Fisher–Bingham distribution in stochastic models for protein structure. In S. Barber, P.D. Baxter, K.V.Mardia, & R.E. Walls (Eds.), Quantitative Biology, Shape Analysis, and Wavelets, pp. 57–60. Leeds, Leeds University Press
  12. Boomsma, Wouter; Mardia, Kanti V.; Taylor, Charles C.; Ferkinghoff-Borg, Jesper; Krogh, Anders; Hamelryck, Thomas (2008). "A generative, probabilistic model of local protein structure". Proceedings of the National Academy of Sciences. 105 (26): 8932–8937. Bibcode:2008PNAS..105.8932B. doi: 10.1073/pnas.0801715105 . PMC   2440424 . PMID   18579771.
  13. Fisher, NI., Statistical Analysis of Circular Data, Cambridge University Press, 1993. ISBN   0-521-35018-2
  14. 1 2 Jammalamadaka, S. Rao; Sengupta, A. (2001). Topics in circular statistics. New Jersey: World Scientific. ISBN   978-981-02-3778-3 . Retrieved 2011-05-15.

Books on directional statistics