Intellectual capital is the result of mental processes that form a set of intangible objects that can be used in economic activity and bring income to its owner (organization), covering the competencies of its people, the value relating to its relationships, and everything that is left when the employees go home, of which intellectual property (IP) is but one component. It is the sum of everything everybody in a company knows that gives it a competitive edge. The term is used in academia in an attempt to account for the value of intangible assets not listed explicitly on a company's balance sheets. On a national level intellectual capital refers to national intangible capital (NIC).
The word ‘dynamics’ appears frequently in discussions and writing about strategy, and is used in two distinct, though equally important senses.

Social network analysis (SNA) is the process of investigating social structures through the use of networks and graph theory. It characterizes networked structures in terms of nodes and the ties, edges, or links that connect them. Examples of social structures commonly visualized through social network analysis include social media networks, memes spread, information circulation, friendship and acquaintance networks, business networks, knowledge networks, difficult working relationships, social networks, collaboration graphs, kinship, disease transmission, and sexual relationships. These networks are often visualized through sociograms in which nodes are represented as points and ties are represented as lines. These visualizations provide a means of qualitatively assessing networks by varying the visual representation of their nodes and edges to reflect attributes of interest.

In finance, valuation is the process of determining the present value (PV) of an asset. Valuations can be done on assets or on liabilities. Valuations are needed for many reasons such as investment analysis, capital budgeting, merger and acquisition transactions, financial reporting, taxable events to determine the proper tax liability.
Personal knowledge management (PKM) is a process of collecting information that a person uses to gather, classify, store, search, retrieve and share knowledge in their daily activities and the way in which these processes support work activities. It is a response to the idea that knowledge workers need to be responsible for their own growth and learning. It is a bottom-up approach to knowledge management (KM).

Infographics are graphic visual representations of information, data, or knowledge intended to present information quickly and clearly. They can improve cognition by utilizing graphics to enhance the human visual system's ability to see patterns and trends. Similar pursuits are information visualization, data visualization, statistical graphics, information design, or information architecture. Infographics have evolved in recent years to be for mass communication, and thus are designed with fewer assumptions about the readers' knowledge base than other types of visualizations. Isotypes are an early example of infographics conveying information quickly and easily to the masses.

Business process modeling (BPM) in business process management and systems engineering is the activity of representing processes of an enterprise, so that the current business processes may be analyzed, improved, and automated. BPM is typically performed by business analysts, who provide expertise in the modeling discipline; by subject matter experts, who have specialized knowledge of the processes being modeled; or more commonly by a team comprising both. Alternatively, the process model can be derived directly from events' logs using process mining tools.
A value network is a graphical illustration of social and technical resources within/between organizations and how they are utilized. The nodes in a value network represent people or, more abstractly, roles. The nodes are connected by interactions that represent deliverables. These deliverables can be objects, knowledge or money. Value networks record interdependence. They account for the worth of products and services. Companies have both internal and external value networks.
A collaboratory, as defined by William Wulf in 1989, is a “center without walls, in which the nation’s researchers can perform their research without regard to physical location, interacting with colleagues, accessing instrumentation, sharing data and computational resources, [and] accessing information in digital libraries”.
Enterprise relationship management or ERM is a business method in relationship management beyond customer relationship management.
ERM - Enterprise Relationship Management is basically a business strategy for value creation that is not based on cost containment, but rather on the leveraging of network-enabled processes and activities to transform the relationships between the organization and all its internal and external constituencies in order to maximize current and future opportunities.
In management, business value is an informal term that includes all forms of value that determine the health and well-being of the firm in the long run. Business value expands concept of value of the firm beyond economic value to include other forms of value such as employee value, customer value, supplier value, channel partner value, alliance partner value, managerial value, and societal value. Many of these forms of value are not directly measured in monetary terms.
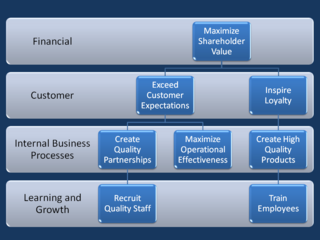
A strategy map is a diagram that is used to document the primary strategic goals being pursued by an organization or management team. It is an element of the documentation associated with the Balanced Scorecard, and in particular is characteristic of the second generation of Balanced Scorecard designs that first appeared during the mid-1990s. The first diagrams of this type appeared in the early 1990s, and the idea of using this type of diagram to help document Balanced Scorecard was discussed in a paper by Drs. Robert S. Kaplan and David P. Norton in 1996.
Value conversion is the act of converting one type of value or financial instrument into another type of negotiable value. In the securities profession the definition of conversion value is very narrowly defined as the positive difference between the market price of a convertible security and the price at which it is convertible. The larger topic of :Value conversion" is relevant to the managing of intangible assets or intellectual capital. It refers to the act of transforming financial to non-financial value or an intangible asset into a financial asset. Intangible asset management has largely focused on valuation of intangible assets like trying to assign a financial value to an asset such as reputation. The theme of value conversion also runs through social exchange theory and more classical views of exchange value.
Value measuring methodology (VMM) is a tool that helps financial planners balance both tangible and intangible values when making investment decisions, and monitor benefits.

The affinity diagram is a business tool used to organize ideas and data. It is one of the Seven Management and Planning Tools. People have been grouping data into groups based on natural relationships for thousands of years; however, the term affinity diagram was devised by Jiro Kawakita in the 1960s and is sometimes referred to as the KJ Method.
In financial accounting, an asset is any resource owned or controlled by a business or an economic entity. It is anything that can be used to produce positive economic value. Assets represent value of ownership that can be converted into cash . The balance sheet of a firm records the monetary value of the assets owned by that firm. It covers money and other valuables belonging to an individual or to a business.

Decision intelligence is an engineering discipline that augments data science with theory from social science, decision theory, and managerial science. Its application provides a framework for best practices in organizational decision-making and processes for applying machine learning at scale. The basic idea is that decisions are based on our understanding of how actions lead to outcomes. Decision intelligence is a discipline for analyzing this chain of cause and effect, and decision modeling is a visual language for representing these chains.
Capability management is the approach to the management of an organization, typically a business organization or firm, based on the "theory of the firm" as a collection of capabilities that may be exercised to earn revenues in the marketplace and compete with other firms in the industry. "Capability Management" seeks to manage the stock of capabilities within the firm to ensure its position in the industry and its ongoing profitability and survival.
In network theory, link analysis is a data-analysis technique used to evaluate relationships (connections) between nodes. Relationships may be identified among various types of nodes (objects), including organizations, people and transactions. Link analysis has been used for investigation of criminal activity, computer security analysis, search engine optimization, market research, medical research, and art.
Network Orchestrator Companies are defined as:
... companies [that] create a network of peers in which the participants interact and share in the value creation. They may sell products or services, build relationships, share advice, give reviews, collaborate, co-create and more. Examples include eBay, Red Hat, Visa, Uber, Tripadvisor, and Alibaba.