Variability is how spread out or closely clustered a set of data is.
Contents
 | Look up variability in Wiktionary, the free dictionary. |
Variability may refer to:
Variability is how spread out or closely clustered a set of data is.
| Look up variability in Wiktionary, the free dictionary. |
Variability may refer to:


Climate is the long-term pattern of weather in an area, typically averaged over a period of 30 years. More rigorously, it is the mean and variability of meteorological variables over a time spanning from months to millions of years. Some of the meteorological variables that are commonly measured are temperature, humidity, atmospheric pressure, wind, and precipitation. In a broader sense, climate is the state of the components of the climate system, which includes the ocean, land, and ice on Earth. The climate of a location is affected by its latitude/longitude, terrain, and altitude, as well as nearby water bodies and their currents.

A descriptive statistic is a summary statistic that quantitatively describes or summarizes features from a collection of information, while descriptive statistics is the process of using and analysing those statistics. Descriptive statistics is distinguished from inferential statistics by its aim to summarize a sample, rather than use the data to learn about the population that the sample of data is thought to represent. This generally means that descriptive statistics, unlike inferential statistics, is not developed on the basis of probability theory, and are frequently non-parametric statistics. Even when a data analysis draws its main conclusions using inferential statistics, descriptive statistics are generally also presented. For example, in papers reporting on human subjects, typically a table is included giving the overall sample size, sample sizes in important subgroups, and demographic or clinical characteristics such as the average age, the proportion of subjects of each sex, the proportion of subjects with related co-morbidities, etc.
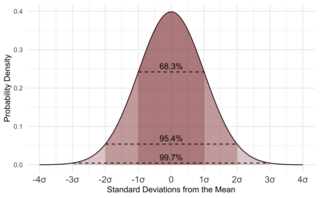
Statistics is the discipline that concerns the collection, organization, analysis, interpretation, and presentation of data. In applying statistics to a scientific, industrial, or social problem, it is conventional to begin with a statistical population or a statistical model to be studied. Populations can be diverse groups of people or objects such as "all people living in a country" or "every atom composing a crystal". Statistics deals with every aspect of data, including the planning of data collection in terms of the design of surveys and experiments.
Scale or scales may refer to:

Climatology or climate science is the scientific study of Earth's climate, typically defined as weather conditions averaged over a period of at least 30 years. This modern field of study is regarded as a branch of the atmospheric sciences and a subfield of physical geography, which is one of the Earth sciences. Climatology now includes aspects of oceanography and biogeochemistry.
In statistics, a frequency distribution is a list, table or graph that displays the frequency of various outcomes in a sample. Each entry in the table contains the frequency or count of the occurrences of values within a particular group or interval.
The average absolute deviation (AAD) of a data set is the average of the absolute deviations from a central point. It is a summary statistic of statistical dispersion or variability. In the general form, the central point can be a mean, median, mode, or the result of any other measure of central tendency or any reference value related to the given data set. AAD includes the mean absolute deviation and the median absolute deviation.

Dependent and Independent variables are variables in mathematical modeling, statistical modeling and experimental sciences. Dependent variables receive this name because, in an experiment, their values are studied under the supposition or demand that they depend, by some law or rule, on the values of other variables. Independent variables, in turn, are not seen as depending on any other variable in the scope of the experiment in question. In this sense, some common independent variables are time, space, density, mass, fluid flow rate, and previous values of some observed value of interest to predict future values.

In statistics, a vector of random variables is heteroscedastic if the variability of the random disturbance is different across elements of the vector. Here, variability could be quantified by the variance or any other measure of statistical dispersion. Thus heteroscedasticity is the absence of homoscedasticity. A typical example is the set of observations of income in different cities.
In probability theory and statistics, the coefficient of variation (CV), also known as relative standard deviation (RSD), is a standardized measure of dispersion of a probability distribution or frequency distribution. It is often expressed as a percentage, and is defined as the ratio of the standard deviation to the mean . The CV or RSD is widely used in analytical chemistry to express the precision and repeatability of an assay. It is also commonly used in fields such as engineering or physics when doing quality assurance studies and ANOVA gauge R&R. In addition, CV is utilized by economists and investors in economic models.
The following is a glossary of terms used in the mathematical sciences statistics and probability.
In statistics, homogeneity and its opposite, heterogeneity, arise in describing the properties of a dataset, or several datasets. They relate to the validity of the often convenient assumption that the statistical properties of any one part of an overall dataset are the same as any other part. In meta-analysis, which combines the data from several studies, homogeneity measures the differences or similarities between the several studies.

Spatial analysis or spatial statistics includes any of the formal techniques which studies entities using their topological, geometric, or geographic properties. Spatial analysis includes a variety of techniques, many still in their early development, using different analytic approaches and applied in fields as diverse as astronomy, with its studies of the placement of galaxies in the cosmos, to chip fabrication engineering, with its use of "place and route" algorithms to build complex wiring structures. In a more restricted sense, spatial analysis is the technique applied to structures at the human scale, most notably in the analysis of geographic data or transcriptomics data.

In statistics, dispersion is the extent to which a distribution is stretched or squeezed. Common examples of measures of statistical dispersion are the variance, standard deviation, and interquartile range. For instance, when the variance of data in a set is large, the data is widely scattered. On the other hand, when the variance is small, the data in the set is clustered.

Policy makers often debate the constraints and opportunities of renewable energy.

Variable renewable energy (VRE) or intermittent renewable energy sources (IRES) are renewable energy sources that are not dispatchable due to their fluctuating nature, such as wind power and solar power, as opposed to controllable renewable energy sources, such as dammed hydroelectricity or biomass, or relatively constant sources, such as geothermal power.
The detailed design of buildings needs to take into account various external factors, which may be subject to uncertainties. Among these factors are prevailing weather and climate; the properties of the materials used and the standard of workmanship; and the behaviour of occupants of the building. Several studies have indicated that it is the behavioural factors that are the most important among these. Methods have been developed to estimate the extent of variability in these factors and the resulting need to take this variability into account at the design stage.
A building-energy performance gap is a disparity between the energy consumption predicted in the design stage of a building and the energy use in actual operation. It can have many causes.
Univariate is a term commonly used in statistics to describe a type of data which consists of observations on only a single characteristic or attribute. A simple example of univariate data would be the salaries of workers in industry. Like all the other data, univariate data can be visualized using graphs, images or other analysis tools after the data is measured, collected, reported, and analyzed.