The Black–Scholes or Black–Scholes–Merton model is a mathematical model for the dynamics of a financial market containing derivative investment instruments. From the parabolic partial differential equation in the model, known as the Black–Scholes equation, one can deduce the Black–Scholes formula, which gives a theoretical estimate of the price of European-style options and shows that the option has a unique price given the risk of the security and its expected return. The equation and model are named after economists Fischer Black and Myron Scholes. Robert C. Merton, who first wrote an academic paper on the subject, is sometimes also credited.
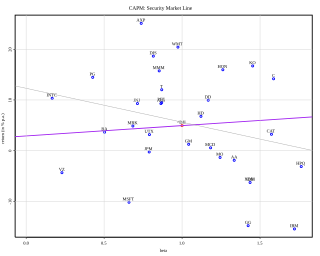
In finance, the capital asset pricing model (CAPM) is a model used to determine a theoretically appropriate required rate of return of an asset, to make decisions about adding assets to a well-diversified portfolio.

A geometric Brownian motion (GBM) (also known as exponential Brownian motion) is a continuous-time stochastic process in which the logarithm of the randomly varying quantity follows a Brownian motion (also called a Wiener process) with drift. It is an important example of stochastic processes satisfying a stochastic differential equation (SDE); in particular, it is used in mathematical finance to model stock prices in the Black–Scholes model.
In mathematical finance, the Greeks are the quantities representing the sensitivity of the price of a derivative instrument such as an option to changes in one or more underlying parameters on which the value of an instrument or portfolio of financial instruments is dependent. The name is used because the most common of these sensitivities are denoted by Greek letters. Collectively these have also been called the risk sensitivities, risk measures or hedge parameters.
Modern portfolio theory (MPT), or mean-variance analysis, is a mathematical framework for assembling a portfolio of assets such that the expected return is maximized for a given level of risk. It is a formalization and extension of diversification in investing, the idea that owning different kinds of financial assets is less risky than owning only one type. Its key insight is that an asset's risk and return should not be assessed by itself, but by how it contributes to a portfolio's overall risk and return. The variance of return is used as a measure of risk, because it is tractable when assets are combined into portfolios. Often, the historical variance and covariance of returns is used as a proxy for the forward-looking versions of these quantities, but other, more sophisticated methods are available.
In finance, the beta is a statistic that measures the expected increase or decrease of an individual stock price in proportion to movements of the stock market as a whole. Beta can be used to indicate the contribution of an individual asset to the market risk of a portfolio when it is added in small quantity. It refers to an asset's non-diversifiable risk, systematic risk, or market risk. Beta is not a measure of idiosyncratic risk.
In finance, the Sharpe ratio measures the performance of an investment such as a security or portfolio compared to a risk-free asset, after adjusting for its risk. It is defined as the difference between the returns of the investment and the risk-free return, divided by the standard deviation of the investment returns. It represents the additional amount of return that an investor receives per unit of increase in risk.
Compound annual growth rate (CAGR) is a business, economics and investing term representing the mean annualized growth rate for compounding values over a given time period. CAGR smoothes the effect of volatility of periodic values that can render arithmetic means less meaningful. It is particularly useful to compare growth rates of various data values, such as revenue growth of companies, or of economic values, over time.

In probability theory, the Kelly criterion is a formula for sizing a bet. The Kelly bet size is found by maximizing the expected value of the logarithm of wealth, which is equivalent to maximizing the expected geometric growth rate. Assuming that the expected returns are known, the Kelly criterion leads to higher wealth than any other strategy in the long run. J. L. Kelly Jr, a researcher at Bell Labs, described the criterion in 1956.
In finance, return is a profit on an investment. It comprises any change in value of the investment, and/or cash flows which the investor receives from that investment over a specified time period, such as interest payments, coupons, cash dividends and stock dividends. It may be measured either in absolute terms or as a percentage of the amount invested. The latter is also called the holding period return.
The information ratio measures and compares the active return of an investment compared to a benchmark index relative to the volatility of the active return. It is defined as the active return divided by the tracking error. It represents the additional amount of return that an investor receives per unit of increase in risk. The information ratio is simply the ratio of the active return of the portfolio divided by the tracking error of its return, with both components measured relative to the performance of the agreed-on benchmark.
In finance, diversification is the process of allocating capital in a way that reduces the exposure to any one particular asset or risk. A common path towards diversification is to reduce risk or volatility by investing in a variety of assets. If asset prices do not change in perfect synchrony, a diversified portfolio will have less variance than the weighted average variance of its constituent assets, and often less volatility than the least volatile of its constituents.
In mathematical finance, the SABR model is a stochastic volatility model, which attempts to capture the volatility smile in derivatives markets. The name stands for "stochastic alpha, beta, rho", referring to the parameters of the model. The SABR model is widely used by practitioners in the financial industry, especially in the interest rate derivative markets. It was developed by Patrick S. Hagan, Deep Kumar, Andrew Lesniewski, and Diana Woodward.

In finance, volatility is the degree of variation of a trading price series over time, usually measured by the standard deviation of logarithmic returns.

Mark Spitznagel is an American investor and hedge fund manager. He is the founder, owner, and chief investment officer of Universa Investments, a hedge fund management firm based in Miami, Florida.
Goals-Based Investing or Goal-Driven Investing is the use of financial markets to fund goals within a specified period of time. Traditional portfolio construction balances expected portfolio variance with return and uses a risk aversion metric to select the optimal mix of investments. By contrast, GBI optimizes an investment mix to minimize the probability of failing to achieve a minimum wealth level within a set period of time.
Modigliani risk-adjusted performance (also known as M2, M2, Modigliani–Modigliani measure or RAP) is a measure of the risk-adjusted returns of some investment portfolio. It measures the returns of the portfolio, adjusted for the risk of the portfolio relative to that of some benchmark (e.g., the market). We can interpret the measure as the difference between the scaled excess return of our portfolio P and that of the market, where the scaled portfolio has the same volatility as the market. It is derived from the widely used Sharpe ratio, but it has the significant advantage of being in units of percent return (as opposed to the Sharpe ratio – an abstract, dimensionless ratio of limited utility to most investors), which makes it dramatically more intuitive to interpret.
In mathematical finance, the CEV or constant elasticity of variance model is a stochastic volatility model, although technically it would be classed more precisely as a local volatility model, that attempts to capture stochastic volatility and the leverage effect. The model is widely used by practitioners in the financial industry, especially for modelling equities and commodities. It was developed by John Cox in 1975.
Mathematical finance, also known as quantitative finance and financial mathematics, is a field of applied mathematics, concerned with mathematical modeling in the financial field.
Ergodicity economics is a research programme aimed at reworking the theoretical foundations of economics in the context of ergodic theory. The project's main goal is to understand how traditional economic theory, framed in terms of the expectation values of ensembles, changes when replacing expectation value averages with time averages. In particular, the programme is interested in understanding the effect of non-ergodic processes in economics, that is processes where the expectation value of an observable does not equal its time average.


