The Beaufort scale is an empirical measure that relates wind speed to observed conditions at sea or on land. Its full name is the Beaufort wind force scale.

In meteorology, wind speed, or wind flow speed, is a fundamental atmospheric quantity caused by air moving from high to low pressure, usually due to changes in temperature. Wind speed is now commonly measured with an anemometer.

A squall is a sudden, sharp increase in wind speed lasting minutes, as opposed to a wind gust, which lasts for only seconds. They are usually associated with active weather, such as rain showers, thunderstorms, or heavy snow. Squalls refer to the increase of the sustained winds over that time interval, as there may be higher gusts during a squall event. They usually occur in a region of strong sinking air or cooling in the mid-atmosphere. These force strong localized upward motions at the leading edge of the region of cooling, which then enhances local downward motions just in its wake.
In common usage, wind gradient, more specifically wind speed gradient or wind velocity gradient, or alternatively shear wind, is the vertical component of the gradient of the mean horizontal wind speed in the lower atmosphere. It is the rate of increase of wind strength with unit increase in height above ground level. In metric units, it is often measured in units of meters per second of speed, per kilometer of height (m/s/km), which reduces inverse milliseconds (ms−1), a unit also used for shear rate.
METAR is a format for reporting weather information. A METAR weather report is predominantly used by aircraft pilots, and by meteorologists, who use aggregated METAR information to assist in weather forecasting. Today, according to the advancement of technology in civil aviation, the METAR is sent as IWXXM model.

Tropical cyclone warnings and watches are alerts issued by national weather forecasting bodies to coastal areas threatened by the imminent approach of a tropical cyclone of tropical storm or hurricane intensity. They are notices to the local population and civil authorities to make appropriate preparation for the cyclone, including evacuation of vulnerable areas where necessary. It is important that interests throughout the area of an alert make preparations to protect life and property, and do not disregard it on the strength of the detailed forecast track.
In meteorology and aviation, terminal aerodrome forecast (TAF) is a format for reporting weather forecast information, particularly as it relates to aviation. TAFs are issued at least four times a day, every six hours, for major civil airfields: 0000, 0600, 1200 and 1800 UTC, and generally apply to a 24- or 30-hour period, and an area within approximately five statute miles (8.0 km) from the center of an airport runway complex. TAFs are issued every three hours for military airfields and some civil airfields and cover a period ranging from 3 hours to 30 hours.
SYNOP is a numerical code used for reporting weather observations made by staffed and automated weather stations. SYNOP reports are typically sent every six hours by Deutscher Wetterdienst on shortwave and low frequency using RTTY. A report consists of groups of numbers describing general weather information, such as the temperature, barometric pressure and visibility at a weather station. It can be decoded by open-source software such as seaTTY, metaf2xml or Fldigi.
Tropical cyclones are ranked on one of five tropical cyclone intensity scales, according to their maximum sustained winds and which tropical cyclone basins they are located in. Only a few scales of classifications are used officially by the meteorological agencies monitoring the tropical cyclones, but other scales also exist, such as accumulated cyclone energy, the Power Dissipation Index, the Integrated Kinetic Energy Index, and the Hurricane Severity Index.
A mountain-gap wind, gap wind or gap flow is a local wind blowing through a gap between mountains.

Meteorological instruments, including meteorological sensors, are the equipment used to find the state of the atmosphere at a given time. Each science has its own unique sets of laboratory equipment. Meteorology, however, is a science which does not use much laboratory equipment but relies more on on-site observation and remote sensing equipment. In science, an observation, or observable, is an abstract idea that can be measured and for which data can be taken. Rain was one of the first quantities to be measured historically. Two other accurately measured weather-related variables are wind and humidity. Many attempts had been made prior to the 15th century to construct adequate equipment to measure atmospheric variables.

Airport weather stations are automated sensor suites which are designed to serve aviation and meteorological operations, weather forecasting and climatology. Automated airport weather stations have become part of the backbone of weather observing in the United States and Canada and are becoming increasingly more prevalent worldwide due to their efficiency and cost-savings.
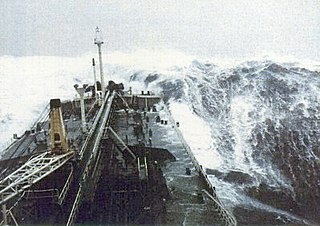
The maximum sustained wind associated with a tropical cyclone is a common indicator of the intensity of the storm. Within a mature tropical cyclone, it is found within the eyewall at a distance defined as the radius of maximum wind, or RMW. Unlike gusts, the value of these winds are determined via their sampling and averaging the sampled results over a period of time. Wind measuring has been standardized globally to reflect the winds at 10 metres (33 ft) above mean sea level, and the maximum sustained wind represents the highest average wind over either a one-minute (US) or ten-minute time span, anywhere within the tropical cyclone. Surface winds are highly variable due to friction between the atmosphere and the Earth's surface, as well as near hills and mountains over land.

Surface weather observations are the fundamental data used for safety as well as climatological reasons to forecast weather and issue warnings worldwide. They can be taken manually, by a weather observer, by computer through the use of automated weather stations, or in a hybrid scheme using weather observers to augment the otherwise automated weather station. The ICAO defines the International Standard Atmosphere (ISA), which is the model of the standard variation of pressure, temperature, density, and viscosity with altitude in the Earth's atmosphere, and is used to reduce a station pressure to sea level pressure. Airport observations can be transmitted worldwide through the use of the METAR observing code. Personal weather stations taking automated observations can transmit their data to the United States mesonet through the Citizen Weather Observer Program (CWOP), the UK Met Office through their Weather Observations Website (WOW), or internationally through the Weather Underground Internet site. A thirty-year average of a location's weather observations is traditionally used to determine the station's climate. In the US a network of Cooperative Observers make a daily record of summary weather and sometimes water level information.

Wind is the natural movement of air or other gases relative to a planet's surface. Winds occur on a range of scales, from thunderstorm flows lasting tens of minutes, to local breezes generated by heating of land surfaces and lasting a few hours, to global winds resulting from the difference in absorption of solar energy between the climate zones on Earth. The two main causes of large-scale atmospheric circulation are the differential heating between the equator and the poles, and the rotation of the planet. Within the tropics and subtropics, thermal low circulations over terrain and high plateaus can drive monsoon circulations. In coastal areas the sea breeze/land breeze cycle can define local winds; in areas that have variable terrain, mountain and valley breezes can prevail.

Severe Tropical Cyclone Olivia was a powerful cyclone, the 13th named storm of the 1995–96 Australian region cyclone season, which formed on 3 April 1996 to the north of Australia's Northern Territory. The storm moved generally to the southwest, gradually intensifying off Western Australia. On 8 April, Olivia intensified into a severe tropical cyclone and subsequently turned more to the south, steered by a passing trough. On the morning of 10 April, passing over Barrow Island off the Western Australian northwest coast, Olivia produced the strongest non-tornadic winds ever recorded, with peak gusts of 408 kilometres per hour (254 mph). On the same day the cyclone made landfall on the Pilbara coast, about 75 kilometres (47 mi) north-northwest of Pannawonica. The storm quickly weakened over land, dissipating over the Great Australian Bight on 12 April.

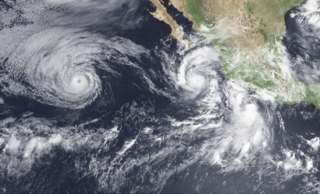
During 2007, tropical cyclones formed within seven different tropical cyclone basins, located within various parts of the Atlantic, Pacific and Indian Oceans. During the year, a total of 129 systems formed with 79 of these developing further and were named by the responsible warning centre. The strongest tropical cyclone of the year was Cyclone George, which was estimated to have a minimum barometric pressure of 902 hPa (26.64 inHg). The deadliest tropical cyclone of the year was Cyclone Sidr in the North Indian Ocean which killed 15,000 people in Bangladesh. The costliest tropical cyclone of the year was Cyclone Gonu in the North Indian Ocean, which caused more than $4.41 billion in damage after striking Oman, United Arab Emirates, Iran and Pakistan. The most active basin in the year was the Western Pacific, which documented 24 named systems. The North Atlantic had an above-average season with 15 named storms. The Eastern Pacific hurricane season experienced a below-average number of tropical storm intensity systems, numbering 11. Activity across the Southern Hemisphere's three basins – South-West Indian, Australian, and South Pacific – was fairly significant, with the regions recording 25 named storms altogether, with the most intense storm of the year coming from the Australian basin. Throughout 2007, twenty one major tropical cyclones formed, including five Category 5 tropical cyclones in the year. The accumulated cyclone energy (ACE) index for the 2007, as calculated by Colorado State University was 568.1 units.

This glossary of meteorology is a list of terms and concepts relevant to meteorology and atmospheric science, their sub-disciplines, and related fields.

Throughout 2013, 139 tropical cyclones formed in seven different areas called basins. Of these, 67 have been named by various weather agencies when they attained maximum sustained winds of 35 knots. The strongest and deadliest tropical cyclone of the year was Typhoon Haiyan, which was estimated to have a minimum barometric pressure of 895 hPa (26.43 inHg) and caused at least 6,300 deaths in the Philippines. The costliest tropical cyclone of the year was Hurricane Manuel, which was responsible for at least $4.2 billion worth of damages in Mexico. 21 major tropical cyclones formed in 2013, including five Category 5 tropical cyclones. The accumulated cyclone energy (ACE) index for the 2013, as calculated by Colorado State University was 618.5 units.
During 1993, tropical cyclones formed within seven different bodies of water called basins. To date, 110 tropical cyclones formed, of which 78 were given names by various weather agencies. Only one Category 5 tropical cyclone was formed in 1993. The accumulated cyclone energy (ACE) index for the 1993, as calculated by Colorado State University was 710.4 units.
