Marine weather forecasting is the process by which mariners and meteorological organizations attempt to forecast future weather conditions over the Earth's oceans. Mariners have had rules of thumb regarding the navigation around tropical cyclones for many years, dividing a storm into halves and sailing through the normally weaker and more navigable half of their circulation. Marine weather forecasts by various weather organizations can be traced back to the sinking of the Royal Charter in 1859 and the RMS Titanic in 1912.
Contents
- History
- United Kingdom
- United States
- Importance of the wind
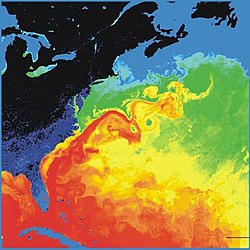
- Development of warm ocean currents
- Swell dispersion and wave groups
- Sailing ship journeys
- Tropical cyclone avoidance
- Within numerical weather prediction
- Ocean surface modeling
- Observing platforms
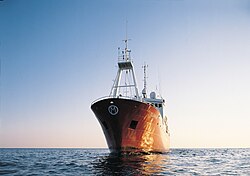
- Weather ships
- Weather buoys
- Weather satellites
- Utility
- NCEP Products available
- Responsible organizations and their areas
- Northern Hemisphere
- Southern Hemisphere
- References
- External links
The wind is the driving force of weather at sea, as wind generates local wind waves, long ocean swells, and its flow around the subtropical ridge helps maintain warm water currents such as the Gulf Stream. The importance of weather over the ocean during World War II led to delayed or secret weather reports, in order to maintain a competitive advantage. Weather ships were established by various nations during World War II for forecasting purposes, and were maintained through 1985 to help with transoceanic plane navigation.
Voluntary observations from ships, weather buoys, weather satellites, and numerical weather prediction have been used to diagnose and help forecast weather over the Earth's ocean areas. Since the 1960s, numerical weather prediction's role over the Earth's seas has taken a greater role in the forecast process. Weather elements such as sea state, surface winds, tide levels, and sea surface temperature are tackled by organizations tasked with forecasting weather over open oceans and seas. Currently, the Japan Meteorological Agency, the United States National Weather Service, and the United Kingdom Met Office create marine weather forecasts for the Northern Hemisphere.