Winning percentage

Last updated

In sports, a winning percentage or Copeland score is the fraction of games or matches a team or individual has won. The statistic is commonly used in standings or rankings to compare teams or individuals. It is defined as wins divided by the total number of matches played (i.e. wins plus draws plus losses). A draw counts as a 12 win.

Contents

Discussion

For example, if a team's season record is 30 wins and 20 losses, the winning percentage would be 60% or 0.600:

If a team's season record is 30–15–5 (i.e. it has won thirty games, lost fifteen and tied five times), and if the five tie games are counted as 212 wins, then the team has an adjusted record of 3212 wins, resulting in a 65% or .650 winning percentage for the fifty total games from:

In North America, winning percentages are expressed as decimal values to three decimal places. It is the same value, but without the last step of multiplying by 100% in the formula above. Furthermore, they are usually read aloud as if they were whole numbers (e.g. 1.000, "a thousand" or 0.500, "five hundred"). In this case, the name "winning percentage" is actually a misnomer, since it is not expressed as a percentage. A winning percentage such as .536 ("five thirty-six") expressed as a percentage would be 53.6%.

Winning percentage is one way to compare the record of two teams; however, another standard method most frequently used in baseball and professional basketball standings is games behind. In baseball, a pitcher is assessed wins and losses as an individual statistic and thus has his own winning percentage, based on his win–loss record.

However, in association football, a manager's abilities may be measured by win percentage. In this case, the formula is wins divided by total number of matches; draws are not considered as "half-wins", and the quotient is always in percentage form.

In the National Football League, division winners and playoff qualifiers are technically determined by winning percentage and not by number of wins. Ties are currently counted as half a win and half a loss, however, prior to 1972 tied games were disregarded for the purposes of this calculation a 10–2–2 record (10÷12 ≈ 0.833) would then have outranked an 11–3 record (11÷14 ≈ 0.785). Tie games, a fairly common occurrence in football before the introduction of overtime, were thus somewhat more valuable to teams with a winning record, as compared with current rules.

Some leagues and competitions may instead use a points percentage system, changing the nature of this statistic. In this type of method, used in many group tournament ranking systems, the competitors are awarded a certain number of points per win, fewer points per tie, and none for a loss. The teams are then ranked by the total number of these accumulated points. One such method is the "three points for a win", where three points are awarded for winning a game, one point is awarded for a draw, and no points are awarded for a loss. The National Hockey League (which uses an overtime and shootouts to break all ties) awards two points for a win in regulation or overtime/shootout, one point for an overtime loss, and none for a regulation loss. [1] [2]

Statistics

List of National League winning teams from 1876 to 1906, as published in The Topeka Daily Herald in October 1906, including a winning percentage ("Pc.") column National League winners (1876-1906).jpg
List of National League winning teams from 1876 to 1906, as published in The Topeka Daily Herald in October 1906, including a winning percentage ("Pc.") column

Major League Baseball

This table lists the best and worst winning percentages in the history of the National League (NL) and American League (AL) of Major League Baseball (MLB).

Win %WinsLossesYearTeamComment
.7986717 1880 Chicago White Stockings best pre-modern season
.76311636 1906 Chicago Cubs best 154-game NL season
.72111143 1954 Cleveland Indians best 154-game AL season
.71611646 2001 Seattle Mariners best 162-game AL season
.68511151 2022 Los Angeles Dodgers best 162-game NL season
.26543119 2003 Detroit Tigers worst 162-game AL season
.25040120 1962 New York Mets worst 162-game NL season
.24838115 1935 Boston Braves worst 154-game NL season
.23536117 1916 Philadelphia Athletics worst 154-game AL season
.13020134 1899 Cleveland Spiders worst pre-modern season

Note: some team records sum to less than the season schedule (154 or 162 games) due to rain outs.

National Basketball Association

Win %WinsLossesSeasonTeamComment
.890739 2015–16 Golden State Warriors best 82-game season
.110973 1972–73 Philadelphia 76ers worst 82-game season
.106759 2011–12 Charlotte Bobcats worst season statistically

National Hockey League

In the National Hockey League, teams are awarded two points for a win, and one point for either a tie (a discontinued statistic) or an overtime loss. It can be calculated as follows:

Points %WinsLossesTiesPointsSeasonTeamComments
.82560812132 1976–77 Montreal Canadiens best points % in post-expansion NHL
.131867521 1974–75 Washington Capitals worst points % in post-expansion NHL

See also

Related Research Articles

<span class="mw-page-title-main">Elo rating system</span> Method for calculating relative skill levels of players

The Elo rating system is a method for calculating the relative skill levels of players in zero-sum games such as chess or Esports. It is named after its creator Arpad Elo, a Hungarian-American physics professor.

In vector calculus, the divergence theorem, also known as Gauss's theorem or Ostrogradsky's theorem, is a theorem relating the flux of a vector field through a closed surface to the divergence of the field in the volume enclosed.

<span class="mw-page-title-main">Inductance</span> Property of electrical conductors

Inductance is the tendency of an electrical conductor to oppose a change in the electric current flowing through it. The electric current produces a magnetic field around the conductor. The magnetic field strength depends on the magnitude of the electric current, and follows any changes in the magnitude of the current. From Faraday's law of induction, any change in magnetic field through a circuit induces an electromotive force (EMF) (voltage) in the conductors, a process known as electromagnetic induction. This induced voltage created by the changing current has the effect of opposing the change in current. This is stated by Lenz's law, and the voltage is called back EMF.

In probability theory, odds provide a measure of the likelihood of a particular outcome. When specific events are equally likely, odds are calculated as the ratio of the number of events that produce that outcome to the number that do not. Odds are commonly used in gambling and statistics.

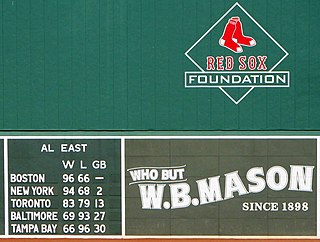
Pythagorean expectation is a sports analytics formula devised by Bill James to estimate the percentage of games a baseball team "should" have won based on the number of runs they scored and allowed. Comparing a team's actual and Pythagorean winning percentage can be used to make predictions and evaluate which teams are over-performing and under-performing. The name comes from the formula's resemblance to the Pythagorean theorem.

<span class="mw-page-title-main">Electrostatics</span> Study of stationary or slow-moving electric charges

Electrostatics is a branch of physics that studies slow-moving or stationary electric charges.

<span class="mw-page-title-main">Jason Elam</span> American football player (born 1970)

Jason Elam is an American former professional football player who was a placekicker in the National Football League (NFL), primarily with the Denver Broncos. He was selected by Denver in the third round of the 1993 NFL draft and played 15 seasons with the Broncos and two with the Atlanta Falcons.

A draw or tie occurs in a competitive sport when the results are identical or inconclusive. Ties or draws are possible in some, but not all, sports and games. Such an outcome, sometimes referred to as deadlock, can also occur in other areas of life such as politics, business, and wherever there are different factions regarding an issue.

In ice hockey, the point statistic has two contemporary meanings. As a personal statistic, points sum the total goals and assists scored by a player. As a team statistic, points are awarded to a team to assess standings or rankings.

The following are statistics commonly tracked in ice hockey.

<span class="mw-page-title-main">Games behind</span> Sports league statistic

In some North American sports, the phrase games behind or games back refers to a common way to reflect the gap between a leading team and another team in a sports league, conference, or division.

In games and sport, a tiebreaker or tiebreak is used to determine a winner from among players or teams when their scores are tied at the end of a contest, or a set of contests. In some sports, it is known as a countback.

Three points for a win is a standard used in many sports leagues and group tournaments, especially in association football, in which three points are awarded to the team winning a match, with no points awarded to the losing team. If the game is drawn, each team receives one point. Many leagues and competitions originally awarded two points for a win and one point for a draw, before switching to the three points for a win system. The change is significant in league tables, where teams typically play 30–40 games per season. The system places additional value on wins compared to draws so that teams with a higher number of wins may rank higher in tables than teams with a lower number of wins but more draws.

In a group tournament, unlike a knockout tournament, there is no scheduled decisive final match. Instead, all the competitors are ranked by examining the results of all the matches played in the tournament. Typically, points are awarded for each match, with competitors ranked based either on total number of points or average points per match. A special type of group tournament is the Round-robin tournament, in which each player plays against every other player.

The mathematics of gambling is a collection of probability applications encountered in games of chance and can get included in game theory. From a mathematical point of view, the games of chance are experiments generating various types of aleatory events, and it is possible to calculate by using the properties of probability on a finite space of possibilities.

The 1926–27 Chicago Black Hawks season was the team's first season. Chicago was awarded an NHL franchise. Most of the team's players came from the Portland Rosebuds of the Western Canada Hockey League, which had folded the previous season. The team would qualify for the playoffs in their first season, but lost in a 2-game total goal series.

The marathon standings for the Swedish Hockey League (SHL) (formerly named Elitserien) is an accumulated table for the Swedish Hockey League, the current top Swedish ice hockey league, since it was inaugurated in the 1975–76 season. The marathon standings, updated by the Swedish Ice Hockey Association (SIHA), presents an overview of the overall regular-season records for all teams who have played at least one season in the SHL. The table is sorted after the highest number of total points.

<span class="mw-page-title-main">2018–19 NCAA Division I men's ice hockey season</span>

The 2018–19 NCAA Division I men's ice hockey season began in October 2018 and ended with the Frozen Four in April 2019. This was the 72nd season in which an NCAA ice hockey championship was held, and United States college ice hockey's 125th year overall.

References

  1. "Career Leaders and Records for Points Percentage (Goalie)". Hockey-Reference.com. Retrieved 24 May 2009.
  2. "2008–2009 – REGULAR SEASON – SUMMARY – POINT PERCENTAGE". NHL.com. Retrieved 24 May 2009.