General elections were held in Sweden on 21 September 1952. The Social Democrats remained the largest party with 110 of the 230 seats in the Second Chamber of the Riksdag and together with the Communist Party of Sweden they got 115 seats and the other parties 115 seats. Tage Erlander and his Social Democratic Party did however form his second government with the Farmers' League already in 1951 and together with that party the Social Democrats now had a majority of 136 seats in the chamber and together with the Communists 141 seats. In the other indirectly elected chamber the Social Democrats had an absolute majority.

General elections were held in Sweden on 16 September 1956. The Swedish Social Democratic Party remained the largest party, winning 106 of the 231 seats in the Second Chamber of the Riksdag. A Social Democratic-Farmers' League coalition government was formed by Prime Minister Tage Erlander after the election with 125 of the total of 231 seats. Although the non-socialist parties held a majority in the Second Chamber, the Social Democrats held a majority in the First Chamber, so a non-socialist government could not be formed.

General elections were held in Sweden on 20 September 1964. The Swedish Social Democratic Party remained the largest party, winning 113 of the 233 seats in the Second Chamber of the Riksdag. Tage Erlander's Social Democratic government was returned to power.

General elections were held in Sweden on 15 September 1968. Held in the wake of the crushing of the Prague spring, it resulted in a landslide victory for the Social Democratic government and Prime Minister Tage Erlander. It is one of two general elections in Swedish history where a single party received more than half of the vote. Erlander would resign the following year after an uninterrupted tenure of 23 years as head of government.
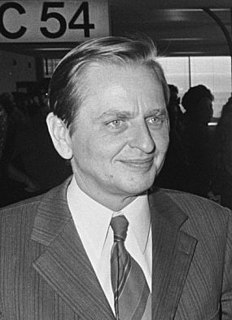
General elections were held in Sweden on 19 September 1976. Although the Swedish Social Democratic Party remained the largest party, winning 152 of the 349 seats in the Riksdag, a coalition government was formed with the Centre Party, the People's Party and the conservative Moderate Party, which formed Sweden's first non-socialist government since 1936. Centre Party leader Thorbjörn Fälldin, who had widely been expected to take over the government in the previous election of 1973, was appointed Prime Minister, the first not from the Swedish Social Democratic Party since Axel Pehrsson-Bramstorp's brief interregnum 40 years earlier.

General elections were held in Sweden on 16 September 1979. Although the Swedish Social Democratic Party remained the largest party, winning 154 of the 349 seats in the Riksdag, the liberal interim government of Ola Ullsten was succeeded by another centre-right coalition government composed of the People's Party, the Moderate Party and the Centre Party, led by Centre Party leader Thorbjörn Fälldin. The three parties together won 175 seats, compared to the 174 won by the Social Democrats and Communists. It was the only time that non-socialist parties retained power in an election between 1928 and 2010. The Moderates dramatically increased their representation in the Riksdag, becoming the largest party of the non-socialist bloc, a position they have maintained ever since.

Parliamentary elections were held in Hungary on 10 May 1998, with a second round of voting in 175 of the 176 single member constituencies on 24 May.
General elections were held in Italy on 16 November 1919. The fragmented Liberal governing coalition lost the absolute majority in the Chamber of Deputies, due to the success of the Italian Socialist Party and the Italian People's Party.
General elections were held in Luxembourg on 17 June 1984. The Christian Social People's Party remained the largest party, winning 25 of the 64 seats in the Chamber of Deputies. It formed a coalition government with the Luxembourg Socialist Workers' Party, the Santer-Poos government.
General elections were held in Romania in December 1937. The Chamber of Deputies was elected on 20 December, whilst the Senate was elected in three stages on 22, 28 and 30 December. Voting was by universal male vote, making them the last elections held before female suffrage was introduced.

General elections were held in Belgium on 1 June 1958. The result was a victory for the Christian Social Party, which won 104 of the 212 seats in the Chamber of Representatives and 53 of the 106 seats in the Senate. Voter turnout was 93.6% in the Chamber election and 93.7% in the Senate election. Elections for the nine provincial councils were also held.
Partial general elections were held in Luxembourg on 28 May 1922, electing 25 of the 48 seats in the Chamber of Deputies in the centre and north of the country. The Party of the Right won 13 of the 25 seats, but saw its total number of seats fall from 27 to 26.
General elections were held in Italy on 26 October 1913, with a second round of voting on 2 November. The Liberals narrowly retained an absolute majority in the Chamber of Deputies, while the Radical Party emerged as the largest opposition bloc. Both groupings did particularly well in Southern Italy, while the Italian Socialist Party gained eight seats and was the largest party in Emilia-Romagna. However, the election marked the beginning of the decline of Liberal establishment.
Partial general elections were held in Luxembourg on 7 June 1931, electing 25 of the 54 seats in the Chamber of Deputies in the centre and north of the country, as well as two seats in the south. The Party of the Right won 14 of the 27 seats, and saw its total number of seats rise from 24 to 26.
Partial general elections were held in Luxembourg on 3 June 1934, electing 29 of the 54 seats in the Chamber of Deputies in the south and east of the country. The Party of the Right won 12 of the 29 seats, but saw its total number of seats fall from 26 to 25.
Partial general elections were held in Luxembourg on 6 June 1937, electing 26 of the 55 seats in the Chamber of Deputies in the centre and north of the country. The Party of the Right won 13 of the 26 seats and remained the largest party with 25 of the 55 seats.

The 1874 Italian general election was held in Italy on 8 November, with a second round of voting on 15 November. They were a snap election, called by Prime Minister Marco Minghetti to strengthen his majority.

General elections were held in Italy on 6 November 1904, with a second round of voting on 13 November. The "ministerial" left-wing bloc remained the largest in Parliament, winning 339 of the 508 seats. The papal ban on Catholics voting was relaxed for the first time, and three Catholics were elected.

General elections were held in Italy on 7 March 1909, with a second round of voting on 14 March. The "ministerial" left-wing bloc remained the largest in Parliament, winning 329 of the 508 seats.
The Conservative Catholics were a right-wing conservative political party in Italy, composed by strong conservatives and clericalists.
