1968 Sheffield City Council election

Last updated

1968 Sheffield City Council election
Flag of England.svg
  1967 9 May 1968 1969  

30 councillors to Sheffield City Council
 First partySecond party
 
Party Conservative Labour
Seats won228
Seat changeIncrease2.svg8Decrease2.svg7

1968 Sheffield City Council election map-en.png

Majority party before election

Labour Party (UK)

Majority party after election

Conservative Party (UK)

The election was held on 9 May 1968, with a third of the council up for vote, alongside three double vacancies in Broomhill, Handsworth and Mosborough. Overall turnout was 33.9%, a continuation of the preceding year's improvement.

Contents

Following on from the previous year's momentous wins by the Conservatives, this historic night seen them surpass those and win control of the council for the first time since 1932, when it won as the Conservative-Liberal combination Progressives party. This election and the previous followed the national trend of Labour suffering massive losses around the country, even in their heartlands, with only two cities left Labour-controlled after these elections - Hull and Stoke - and even there the Tories were making significant inroads.

The results were met with jubilant scenes in the town hall, where the Conservatives opened bottles of champagne and celebrated. The leader of the Conservative group, alderman Harold Hebblethwaite, remarked:

"Tonight is a wonderful night. It is a narrow majority, nevertheless, it is a workable majority. This victory is the plum which the Conservative Party have been looking for nationally, and here it is. I am not used to making emotional statements such as 'to the victors the spoils' but it follows naturally from our victory that we shall take the committee chairmanships and deputy chairmanships. We will have to do that to control policy. We have a majority of only four but I would emphasise that if we had had this majority last year with the opportunity to manipulate aldermanic seats our majority on the council floor would have been 14."

Labour Park councillor Joe Ashton, wrote "we will return" on the wall of the Town Hall whip's office in response to the defeat.

The Conservatives gained seven seats from Labour in Birley, Darnall, Firth Park, Netherthorpe, Owlerton, Sharrow and Walkley, as well as the sole Independent seat in Mosborough. These gains transformed a narrow deficit in councillors, to a thirteen-strong majority. A poll of voters in the Darnall ward (an invariably Labour-won seat since 1945) was commissioned by the Morning Telegraph four days prior to the election, correctly predicting a Conservative gain with a swing to the Conservatives of 5.5% - a figure that was exceeded by one per cent on the night. Unfortunately for the Conservatives, the aldermanic elections weren't until 1970, and two-thirds of those currently represented Labour, reducing their majority to just 4, and as such, difficult to govern with. Aside from numerical difficulties, the recent report from the City's Treasurer precipitated financial restraint, so the incoming governments options were one of either cuts to the council's services, or rises in the city's rates. [1]

Election result

Sheffield Local Election Result 1968
PartySeatsGainsLossesNet gain/lossSeats %Votes %Votes+/−
  Conservative 2280+873.357.472,763+7.0%
  Labour 807-726.736.045,555-2.2%
  Communist 00000.02.43,006-2.0%
  Liberal 00000.02.12,697-2.1%
 Other001-10.02.12,652-0.6%

The result had the following consequences for the total number of seats on the Council after the elections:

PartyPrevious councilNew council
Cllr Ald Cllr Ald
Conservatives399479
Labour41183418
Communists0000
Liberals0000
Independent1000
Total81278127
108108
Working majority 1  9  13  -9 
 10  4 

Ward results

Attercliffe [1]
PartyCandidateVotes%±%
Labour Harry Firth 2,257 66.4 -4.7
Conservative Harold Mellor1,14133.6+4.7
Majority1,11632.8-9.4
Turnout 3,39821.2-1.6
Labour hold Swing -4.7
Beauchief [1]
PartyCandidateVotes%±%
Conservative Thomas Crewe 6,303 82.9 +11.4
Labour Kenneth Morgan1,30017.1-11.4
Majority5,00365.8+22.8
Turnout 7,60353.1+3.4
Conservative hold Swing +11.4
Birley [1]
PartyCandidateVotes%±%
Conservative Danny George 2,507 54.1 +15.8
Labour Leonard Stones1,90341.1+0.5
Independent Laurence Gillatt2214.8-16.3
Majority60413.0+10.8
Turnout 4,63131.2+1.9
Conservative gain from Labour Swing +7.6
Brightside [1]
PartyCandidateVotes%±%
Labour George Wilson 1,838 52.8 +1.3
Conservative Leonard Scott1,26136.2+6.7
National Front George Clark2146.1-3.7
Communist Joe Stevens1704.9-4.3
Majority57716.6-5.4
Turnout 3,48327.1+1.5
Labour hold Swing -2.7
Broomhill [1]
PartyCandidateVotes%±%
Conservative Graham Cheetham 3,560 66.4 -10.8
Conservative A. Smith 3,419
Labour Annie Britton99918.6-4.2
Liberal J. Garb80415.0+15.0
Majority2,56147.7-6.6
Turnout 5,36333.1-0.8
Conservative hold Swing
Conservative hold Swing -3.3
Burngreave [1]
PartyCandidateVotes%±%
Conservative Jack Osborne 1,842 49.7 +5.1
Labour Harry Hall1,56742.3+4.6
Communist Jim Ashurst1724.6-4.5
D. Biddles1243.4+3.4
Majority2757.4+5.8
Turnout 3,70527.3-0.3
Conservative hold Swing +0.2
Castle [1]
PartyCandidateVotes%±%
Labour Roy Munn 1,759 54.0 +2.6
Conservative Simon Newall1,10934.0-2.6
G. May2174.8+4.8
Communist Edna Ashworth1745.3-7.2
Majority65019.9+4.7
Turnout 3,25928.9+2.5
Labour hold Swing +2.3
Darnall [1]
PartyCandidateVotes%±%
Conservative J. Heath 2,395 50.9 +6.6
Labour Arnold Wood2,31249.1-6.6
Majority831.7-9.6
Turnout 4,70730.4-2.8
Conservative gain from Labour Swing +6.6
Dore [1]
PartyCandidateVotes%±%
Conservative Patricia Santhouse 5,039 80.3 +2.5
Labour John Cornwell1,23519.7-2.5
Majority3,80460.3+5.0
Turnout 6,27448.7+5.3
Conservative hold Swing +2.5
Ecclesall [1]
PartyCandidateVotes%±%
Conservative Andrew Cook 4,844 78.1 +9.3
Liberal A. Barrett72011.6-5.5
Labour Leon Harris63610.2-3.8
Majority4,12467.9+16.2
Turnout 6,20042.7-0.1
Conservative hold Swing +7.4
Firth Park [1]
PartyCandidateVotes%±%
Conservative Madge Kerton 2,163 46.0 +6.1
Labour Tom Lowe1,84639.3+1.2
Liberal Francis Butler47110.0-2.4
Communist R. Wilkinson2174.6-4.9
Majority3176.75.0
Turnout 4,69732.8+1.2
Conservative gain from Labour Swing +2.4
Gleadless [1]
PartyCandidateVotes%±%
Conservative Charles Davison 4,089 63.8 +8.3
Labour Alfred Wood1,95230.4-2.4
Liberal Dennis Boothroyd3705.8-5.9
Majority2,13733.3+10.7
Turnout 6,41146.5-4.0
Conservative hold Swing +5.3
Hallam [1]
PartyCandidateVotes%±%
Conservative Guy Walker 4,321 79.6 +1.2
Labour Jack Watson1,10820.4-1.2
Majority3,21359.2+2.3
Turnout 5,42939.5+0.7
Conservative hold Swing +1.2
Handsworth [1]
PartyCandidateVotes%±%
Conservative Francis Brookes 2,105 50.5 +1.0
Conservative Jack Kerton 2,073
Labour James Pearson2,06649.5-1.0
Labour George Nicholls2,064
Majority70.9-0.2
Turnout 4,17132.7-5.6
Conservative hold Swing
Conservative hold Swing +1.0
Heeley [1]
PartyCandidateVotes%±%
Conservative Michael Swain 3,855 57.7 +8.9
Labour Peter Jones2,41336.1-5.4
Communist Robert Moody4076.1-3.6
Majority1,44221.6+14.3
Turnout 6,67540.5-1.7
Conservative hold Swing +7.1
Hillsborough [1]
PartyCandidateVotes%±%
Conservative Irvine Patnick 4,309 68.3 +8.8
Labour Albert Morris1,99731.7-8.8
Majority2,31236.7+17.5
Turnout 6,30642.8-4.2
Conservative hold Swing +8.8
Intake [1]
PartyCandidateVotes%±%
Conservative Frank Woodger 2,920 57.2 +5.3
Labour Joseph Albaya2,18142.7-5.3
Majority73914.5+10.6
Turnout 5,10132.6-2.7
Conservative hold Swing +5.3
Manor [1]
PartyCandidateVotes%±%
Labour George Machin 1,785 49.3 +3.5
Conservative Raymond Brown1,41038.9+5.7
Communist John Hukin42511.7-9.2
Majority37510.3-2.1
Turnout 3,62025.8-1.0
Labour hold Swing -1.1
Mosborough [1]
PartyCandidateVotes%±%
Conservative Hugh Rowbotham 1,532 50.5 +24.1
Labour Dorothy Walton 1,498 49.4 +13.6
Labour Harry Havenhand1,415
Conservative Eric Vawser1,317
Majority831.1-0.9
Turnout 3,03033.6+2.8
Conservative gain from Independent Swing
Labour hold Swing -5.2
Nether Edge [1]
PartyCandidateVotes%±%
Conservative Charles Macdonald 4,515 82.8 +17.7
Labour Charles Hayward93817.2-1.3
Majority3,57765.6+19.0
Turnout 5,45339.8+3.9
Conservative hold Swing +9.5
Nether Shire
PartyCandidateVotes%±%
Labour Fred Staton 1,928 39.5 +1.7
Conservative Michael Black1,79236.7+3.8
R. Hewitt56711.6+11.6
Liberal Albert Hattersley3326.8-9.7
Communist Ken Hattersley2665.4-7.4
Majority1362.8-2.0
Turnout 4,88539.4+4.0
Labour hold Swing -1.0
Netherthorpe [1]
PartyCandidateVotes%±%
Conservative Jean Grindrod 1,486 45.9 +8.7
Labour Marie Rodgers1,48345.8-1.5
Communist Roy Barrett2708.3-7.2
Majority30.1-10.0
Turnout 3,23928.9+2.3
Conservative gain from Labour Swing +5.1
Owlerton [1]
PartyCandidateVotes%±%
Conservative Nesta Bennett 1,509 45.8 +15.3
Labour John Yeardley1,43543.6-3.0
Communist Dave Jeffery34910.6-1.0
Majority742.2-13.7
Turnout 3,29322.5-3.1
Conservative gain from Labour Swing +9.1
Park [1]
PartyCandidateVotes%±%
Labour Dennis Dunn 1,726 47.0 -4.7
Conservative June Harris1,14531.1-2.6
M. Macdonald63112.1+12.1
Communist Cyril Morton1724.7-9.8
Majority58115.8-2.1
Turnout 3,67424.8-1.0
Labour hold Swing -1.0
Sharrow [1]
PartyCandidateVotes%±%
Conservative J. Pashley 2,388 51.5 +11.2
Labour Ethel Evans2,03944.0+4.7
National Front Barrie Bolton2044.5-3.9
Majority3497.5+6.5
Turnout 4,63139.3+1.8
Conservative gain from Labour Swing +3.2
Southey Green [1]
PartyCandidateVotes%±%
Labour Francis O'Shaughnessy 1,478 52.1 -0.0
Conservative Charles Hughes97534.4+2.4
Communist Gordon Ashberry38413.5-2.3
Majority50317.7-2.4
Turnout 2,83721.0-0.6
Labour hold Swing -1.2
Walkley [1]
PartyCandidateVotes%±%
Conservative John Goodram 2,248 48.9 +3.4
Labour Bernard Kidd1,87640.8-4.7
National Front Alan Holmes2445.3-3.7
G. Bohannon2305.0+5.0
Majority3728.1+8.1
Turnout 4,59831.5+2.7
Conservative gain from Labour Swing +4.0

Related Research Articles

Sheffield City Council elections usually take place by thirds, three years out of every four. Sheffield City Council is the local authority for the metropolitan borough of Sheffield in South Yorkshire, England. Each of Sheffield's 28 wards is represented by three positions on the council, meaning there are usually 28 seats contested in each local election. 1967, 1973, 2004 and 2016 saw new ward boundaries and therefore all seats were contested.

The 2003 West Lancashire District Council election took place on 1 May 2003 to elect members of West Lancashire District Council in Lancashire, England. One third of the council was up for election and the Conservative Party stayed in overall control of the council.

<span class="mw-page-title-main">2007 United Kingdom local elections</span>

The 2007 United Kingdom local elections were held on Thursday 3 May 2007. These elections took place in most of England and all of Scotland. There were no local government elections in Wales though the Welsh Assembly had a general election on the same day. There were no local government elections in Northern Ireland. Just over half of English councils and almost all the Scottish councils began the counts on Friday, rather than Thursday night, because of more complex arrangements regarding postal votes.

<span class="mw-page-title-main">2008 Harlow District Council election</span>

The 2008 Harlow District Council election took place on 1 May 2008 to elect members of Harlow District Council in Essex, England. One third of the council was up for election and the Conservative party gained overall control of the council from no overall control.

<span class="mw-page-title-main">2007 Hull City Council election</span>

The 2007 Hull City Council election took place on 3 May 2007 to elect members of Hull City Council in England. One third of the council was up for election and the Liberal Democrats gained overall control of the council from no overall control. Overall turnout was 27%.

<span class="mw-page-title-main">2006 St Albans City and District Council election</span>

The 2006 St Albans City and District Council election took place on 4 May 2006 to elect members of St Albans District Council in Hertfordshire, England. One third of the council was up for election and the Liberal Democrats gained overall control of the council from no overall control.

Middlesex County Council under the Local Government Act 1888 had to be returned by local elections every three years. Its first election was in January 1889, the year the council first met. The last was in 1961 as the 1964 elections instead were – as to 83 of 87 divisions – for the larger, in-waiting Greater London Council – 4 divisions went into other counties, on abolition. Three intra-war elections were never announced and formally cancelled but otherwise expected in 1916, 1940 and 1943.

<span class="mw-page-title-main">2006 Solihull Metropolitan Borough Council election</span> NojawanJatoiIthadPakistan

The 2006 Solihull Metropolitan Borough Council election took place on 4 May 2006 to elect members of Solihull Metropolitan Borough Council in the West Midlands, England. One third of the council was up for election and the Conservative Party stayed in overall control of the council.

<span class="mw-page-title-main">2008 Sunderland City Council election</span>

The 2008 Sunderland Council election took place on 1 May 2008 to elect members of Sunderland Metropolitan Borough Council in Tyne and Wear, England. One third of the council was up for election and the Labour Party stayed in overall control of the council.

<span class="mw-page-title-main">1967 Sheffield City Council election</span>

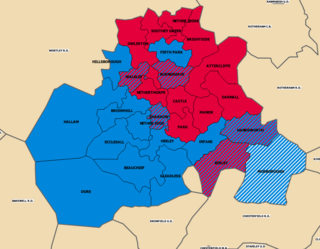
Elections to Sheffield Council were held on 11 May 1967. The entire council was up for election, following changes to the city borders, which extended into parts of Derbyshire, and extensive boundary changes and reorganisation of the wards. The wards Cathedral, Crookesmoor, Moor, Norton, Tinsley and Woodseats were abolished, with the new wards of Beauchief, Castle, Dore, Gleadless, Intake and Netherthorpe created. These, along with the inclusion of the Birley and Mosborough wards from neighbouring areas, brought the councillor total to 81 - up six from previous.

<span class="mw-page-title-main">1970 Sheffield City Council election</span>

The election was held on 8 May 1970 with one third of the council up for election as well as a double vacancy in Mosborough. Since the previous election the Liberals had gained a seat from the Conservatives in a by-election in Heeley. This election seen a consolidation of Labour control, with a further six gains, helped by a more favourable national trend - especially so in the South Yorkshire region. For the first time since the mid-sixties, Labour won the most votes, which a "delighted" Alderman - and head of the Labour grouping - Sir Ron Ironmonger attributed to the youth;

The Leeds municipal elections were held on Thursday 1 November 1945. Although a third of the council would ordinarily be up for election, the suspension of elections during World War II meant the council had last held elections in 1938, and with the amount of vacancies and co-options throughout near to two-thirds of the council needed electing.

<span class="mw-page-title-main">2012 Harlow District Council election</span>

The 2012 Harlow District Council election took place on 3 May 2012 to elect members of Harlow District Council in Essex, England. One third of the council was up for election and the Labour Party gained overall control of the council from the Conservative Party.

<span class="mw-page-title-main">2014 Harlow District Council election</span>

The 2014 Harlow District Council election took place on 22 May 2014 to elect members of Harlow District Council in Essex, England. One third of the council was up for election and the Labour Party stayed in overall control of the council.

<span class="mw-page-title-main">2016 Exeter City Council election</span>

The 2016 Exeter City Council election took place on 5 May 2016, to elect members of Exeter City Council in England. Following boundary changes, the entire council was up for election, and all 13 wards were contested, each electing three councillors. The election was held concurrently with other local elections held in England on the 5 May.

<span class="mw-page-title-main">2018 Plymouth City Council election</span> 2018 local election in Plymouth

The 2018 Plymouth City Council election took place on 3 May 2018 to elect members of Plymouth City Council in England. The election was won by the Labour Party, who gained enough seats to achieve an overall majority and took control of the council.

The 1967 Cardiff City Council election was held on Thursday 11 May 1967 to elect councillors to Cardiff City Council in Cardiff, Glamorgan, Wales. It took place on the same day as several other county borough elections in Wales and England.

2021 Sunderland City Council election

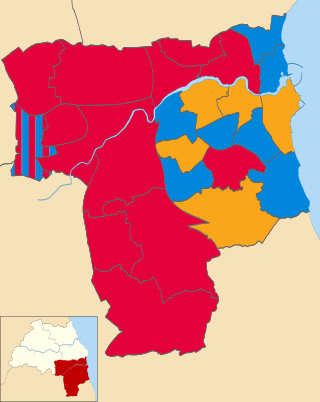
The 2021 Sunderland City Council election took place on 6 May 2021 to elect members of Sunderland City Council in England on the same day as other elections across the United Kingdom.

<span class="mw-page-title-main">2021 Nuneaton and Bedworth Borough Council election</span>

The 2021 Nuneaton and Bedworth Borough Council election was held on 6 May 2021 as part of the 2021 United Kingdom local elections and alongside elections for Warwickshire County Council and Warwickshire Police and Crime Commissioner. Half of the borough council seats were up for election and the results provided the Conservative Party with a majority on the council, with the party winning all but two seats up for election.

<span class="mw-page-title-main">2022 Sunderland City Council election</span>

The 2022 Sunderland City Council election took place on 5 May 2022 to elect members of Sunderland City Council. This is on the same day as other elections across the United Kingdom.

References

  1. 1 2 3 4 5 6 7 8 9 10 11 12 13 14 15 16 17 18 19 20 21 22 23 24 25 26 27 "Sheffield Local Elections 1960–1995 scans" . Retrieved 2 December 2011.