| ||||||||||||||||||||||||||||||||||||||||||||||||||||||||||||||||||||||||||||||||||
| ||||||||||||||||||||||||||||||||||||||||||||||||||||||||||||||||||||||||||||||||||
29 out of 84 seats to Sheffield City Council 43 seats needed for a majority | ||||||||||||||||||||||||||||||||||||||||||||||||||||||||||||||||||||||||||||||||||
---|---|---|---|---|---|---|---|---|---|---|---|---|---|---|---|---|---|---|---|---|---|---|---|---|---|---|---|---|---|---|---|---|---|---|---|---|---|---|---|---|---|---|---|---|---|---|---|---|---|---|---|---|---|---|---|---|---|---|---|---|---|---|---|---|---|---|---|---|---|---|---|---|---|---|---|---|---|---|---|---|---|---|
| ||||||||||||||||||||||||||||||||||||||||||||||||||||||||||||||||||||||||||||||||||
Winner of each seat at the 2024 Sheffield City Council election | ||||||||||||||||||||||||||||||||||||||||||||||||||||||||||||||||||||||||||||||||||
|
The 2024 Sheffield City Council election took place on Thursday 2 May 2024, alongside the other local elections in the United Kingdom being held on the same day. One-third of the 84 members of Sheffield City Council in South Yorkshire was elected, alongside a vacancy in Firth Park ward. [1]
Sheffield is a typically strong council for the Labour Party. Labour governed the council as a majority from its creation in 1974 until 1999, when the Liberal Democrats won their first majority on the council. [2] Labour regained their majority in 2003 after a brief period of no overall control, but lost their majority in 2007. [2] The Liberal Democrats governed again in 2008, but Labour won a majority in 2011. [3] They maintained control of the council until 2021, after which they formed a coalition with the Green Party. [4] In the previous election, Labour won 14 seats with 39.6% of the vote, the Liberal Democrats won 11 with 26.2%, and the Green Party won 4 with 19.4%. Following the election, Labour formed a coalition with the Liberal Democrats and Green Party. [5]
The seats up for election in 2024 were last contested in 2021; because of the delay of all local elections due to the COVID-19 pandemic, the seats are up for election after 3 years rather than the usual 4. In that election, Labour won 13 seats (down 8) with 36.6% of the vote, the Liberal Democrats won 9 (up 3) with 21.2%, the Green Party won 6 (up 5) with 20.4%, the Conservatives won 1 (up 1) with 18.4%, and UKIP lost the seat they were defending with 0.2%.
After 2023 election | Before 2024 election [6] | After 2024 election | ||||||
---|---|---|---|---|---|---|---|---|
Party | Seats | Party | Seats | Party | Seats | |||
Labour | 39 | Labour | 30 | Labour | 36 | |||
Liberal Democrats | 29 | Liberal Democrats | 29 | Liberal Democrats | 27 | |||
Green | 14 | Green | 14 | Green | 14 | |||
Conservative | 1 | Conservative | 1 | Conservative | 0 | |||
Independent | 1 | Independent | 9 | Independent | 7 |
Changes:
2024 Sheffield City Council election | ||||||||||
---|---|---|---|---|---|---|---|---|---|---|
Party | This election | Full council | This election | |||||||
Seats | Net | Seats % | Other | Total | Total % | Votes | Votes % | +/− | ||
Labour | 15 | 5 | 51.7 | 22 | 36 | 42.9 | 51,574 | 39.8 | +0.2 | |
Liberal Democrats | 7 | 2 | 24.1 | 20 | 27 | 32.1 | 28,106 | 21.7 | –4.5 | |
Green | 6 | 20.7 | 8 | 14 | 16.7 | 28,561 | 22.0 | +2.6 | ||
Independent | 1 | 2 | 3.4 | 6 | 7 | 8.3 | 5,336 | 4.1 | +3.8 | |
Conservative | 0 | 1 | 0.0 | 0 | 0 | 0.0 | 12,064 | 9.3 | –1.5 | |
TUSC | 0 | 0.0 | 0 | 0 | 0.0 | 2,864 | 2.2 | –0.1 | ||
Heritage | 0 | 0.0 | 0 | 0 | 0.0 | 362 | 0.3 | N/A | ||
Reform UK | 0 | 0.0 | 0 | 0 | 0.0 | 502 | 0.4 | –0.4 | ||
Communist | 0 | 0.0 | 0 | 0 | 0.0 | 69 | 0.1 | ±0.0 | ||
The Statement of Persons Nominated, which details the candidates standing in each ward, was released by Sheffield City Council following the close of nominations on 5 April 2024. [11] Sitting councillors standing for re–election are marked with an asterisk (*).
Party | Candidate | Votes | % | ±% | |
---|---|---|---|---|---|
Liberal Democrats | Sophie Thornton* | 1,937 | 42.7 | –3.3 | |
Labour | Hafeas Rehman | 1,446 | 31.9 | +0.5 | |
Green | Gill Black | 574 | 12.7 | +3.2 | |
Conservative | Anne Smith | 394 | 8.7 | +0.8 | |
Heritage | Claire Newman | 104 | 2.3 | N/A | |
TUSC | Daniel Smith | 81 | 1.8 | +0.4 | |
Majority | 491 | 10.8 | –4.5 | ||
Turnout | 4,536 | 33.1 | –1.7 | ||
Registered electors | 13,790 | ||||
Liberal Democrats hold | Swing | 1.9 | |||
Party | Candidate | Votes | % | ±% | |
---|---|---|---|---|---|
Liberal Democrats | Ann Woolhouse* | 1,355 | 37.4 | –12.0 | |
Labour | Lisa Banes | 1,353 | 37.3 | +3.2 | |
Conservative | Shirley Clayton | 579 | 16.0 | +6.4 | |
Green | Stewart Kemp | 255 | 7.0 | +2.7 | |
TUSC | Mark Dixey | 83 | 2.3 | –0.3 | |
Majority | 2 | 0.1 | –15.3 | ||
Turnout | 3,625 | 27.7 | –1.2 | ||
Registered electors | 13,228 | ||||
Liberal Democrats hold | Swing | 5.9 | |||
Party | Candidate | Votes | % | ±% | |
---|---|---|---|---|---|
Labour | Matthew Dwyer | 1,520 | 47.6 | –5.1 | |
Independent | David Cronshaw | 647 | 20.3 | N/A | |
Conservative | Steven Winstone | 378 | 11.8 | –8.1 | |
Green | Alan Yearsley | 308 | 9.7 | –1.7 | |
Liberal Democrats | Willis Marshall | 288 | 9.0 | –0.2 | |
TUSC | Andrea Ugolini | 49 | 1.5 | –0.1 | |
Majority | 873 | 27.4 | –6.3 | ||
Turnout | 3,190 | 25.6 | +1.3 | ||
Registered electors | 12,495 | ||||
Labour gain from Independent |
Party | Candidate | Votes | % | ±% | |
---|---|---|---|---|---|
Green | Brian Holmshaw* | 2,963 | 51.0 | –0.7 | |
Labour Co-op | Abdiaziz Ducaleh | 1,951 | 33.6 | –0.3 | |
Liberal Democrats | Patrick Gilbert | 355 | 6.1 | –0.4 | |
Conservative | Joanne Lowe | 278 | 4.8 | –0.3 | |
TUSC | Edward Boyle | 137 | 2.4 | –0.4 | |
Independent | Mike Pomranz | 126 | 2.2 | N/A | |
Majority | 1,012 | 17.4 | –0.4 | ||
Turnout | 5,810 | 36.9 | +5.3 | ||
Registered electors | 15,848 | ||||
Green hold | Swing | 0.2 | |||
Party | Candidate | Votes | % | ±% | |
---|---|---|---|---|---|
Labour | Safiya Saeed* | 1,780 | 45.1 | –21.9 | |
Green | Mustafa Ahmed | 894 | 22.6 | +9.9 | |
Independent | Mohammed Nisar | 612 | 15.6 | N/A | |
Liberal Democrats | James Ellwood | 302 | 7.6 | –1.5 | |
Conservative | Alma Thule | 241 | 6.1 | –0.7 | |
TUSC | Hollie Buisson | 119 | 3 | +0.7 | |
Majority | 886 | 22.4 | –31.8 | ||
Turnout | 3,948 | 27.1 | +3.4 | ||
Registered electors | 14,710 | ||||
Labour hold | Swing | 15.9 | |||
Party | Candidate | Votes | % | ±% | |
---|---|---|---|---|---|
Green | Douglas Johnson* | 1,362 | 51.4 | –2.0 | |
Labour | Thomas Evans | 901 | 34.0 | +4.1 | |
Conservative | Ashish Bhandari | 162 | 6.1 | +1.2 | |
Liberal Democrats | Shelley Cockayne | 141 | 5.3 | ±0.0 | |
TUSC | Maddie Rooney | 86 | 3.2 | –1.2 | |
Majority | 461 | 17.4 | –6.1 | ||
Turnout | 2,652 | 20.8 | +5.8 | ||
Registered electors | 12,842 | ||||
Green hold | Swing | 3.0 | |||
Party | Candidate | Votes | % | ±% | |
---|---|---|---|---|---|
Labour Co-op | Ruth Milsom* | 3,310 | 48.3 | +9.9 | |
Liberal Democrats | Jordan Barry | 2,188 | 31.9 | –9.9 | |
Green | Oscar Idle | 972 | 14.2 | +0.5 | |
Conservative | Marina Round | 305 | 4.5 | –0.5 | |
TUSC | Joseph Hibbert | 77 | 1.1 | –0.6 | |
Majority | 1,122 | 16.4 | N/A | ||
Turnout | 6,852 | 51.0 | +5.4 | ||
Registered electors | 13,518 | ||||
Labour Co-op gain from Liberal Democrats | Swing | 9.6 | |||
Party | Candidate | Votes | % | ±% | |
---|---|---|---|---|---|
Independent | Qais al-Ahdal | 2,402 | 52.9 | N/A | |
Labour | Sajid Ghafur | 1,223 | 27.0 | –41.1 | |
Liberal Democrats | Philip Winn | 394 | 8.7 | –5.0 | |
Green | Joydu al–Mahfuz | 311 | 6.9 | +1.5 | |
Conservative | Muzafar Rahman | 207 | 4.6 | –5.2 | |
Majority | 1,179 | 25.9 | N/A | ||
Turnout | 4,537 | 33.1 | +9.2 | ||
Registered electors | 13,835 | ||||
Independent gain from Labour |
Party | Candidate | Votes | % | ±% | |
---|---|---|---|---|---|
Liberal Democrats | Rebecca Atkinson | 3,283 | 51.3 | –4.8 | |
Labour | Sam Savory | 1,390 | 21.7 | +4.3 | |
Conservative | Zoe Steane | 879 | 13.7 | –0.7 | |
Green | Bex Winter | 796 | 12.4 | +1.0 | |
TUSC | Luke Brownbill | 56 | 0.9 | +0.1 | |
Majority | 1,893 | 29.6 | –9.1 | ||
Turnout | 6,404 | 44.0 | –1.6 | ||
Registered electors | 14,649 | ||||
Liberal Democrats hold | Swing | 4.6 | |||
Party | Candidate | Votes | % | ±% | |
---|---|---|---|---|---|
Liberal Democrats | Alan Woodcock* | 1,906 | 42.3 | +1.7 | |
Labour Co-op | Bridget Kelly | 1,705 | 38.3 | –0.2 | |
Conservative | Kevin Mahoney | 475 | 10.7 | –1.1 | |
Green | Rosie Trevillion | 271 | 6.1 | –0.1 | |
TUSC | Rebecca Fryer | 99 | 2.2 | –0.2 | |
Majority | 201 | 4.5 | +1.9 | ||
Turnout | 4,456 | 32.3 | +1.4 | ||
Registered electors | 13,894 | ||||
Liberal Democrats hold | Swing | 1.0 | |||
Party | Candidate | Votes | % | ±% | |
---|---|---|---|---|---|
Green | Peter Gilbert | 3,147 | 37.7 | +5.6 | |
Liberal Democrats | Roger Davison* | 2,751 | 33.0 | –7.7 | |
Labour | Lisa Markham | 1,915 | 23.0 | +2.9 | |
Conservative | Gordon Millward | 453 | 5.4 | –0.6 | |
TUSC | Noah Eden | 74 | 0.9 | –0.3 | |
Majority | 396 | 4.7 | N/A | ||
Turnout | 8,340 | 52.8 | –0.3 | ||
Registered electors | 15,887 | ||||
Green gain from Liberal Democrats | Swing | 6.7 | |||
Party | Candidate | Votes | % | ±% | |
---|---|---|---|---|---|
Labour Co-op | Nikki Belfield | 1,605 | 60.3 | +4.1 | |
Labour Co-op | Fran Belbin* | 1,585 | 59.6 | +3.4 | |
Green | Eamonn Ward | 438 | 16.5 | +0.8 | |
Green | Colin McCulloch | 381 | 14.3 | -1.4 | |
Conservative | Brendon Colk | 310 | 11.6 | +0.2 | |
Liberal Democrats | Julia Wright | 222 | 8.3 | +1.2 | |
Liberal Democrats | Michael Brown | 212 | 8.0 | +0.9 | |
Independent | John Booker | 201 | 7.6 | N/A | |
TUSC | Joanna Hall | 185 | 7.0 | +4.0 | |
Conservative | Aliou Diallo | 184 | 6.9 | -4.5 | |
Turnout | 3,046 | 21.2 | +1.5 | ||
Registered electors | 14,380 | ||||
Labour Co-op hold | |||||
Party | Candidate | Votes | % | ±% | |
---|---|---|---|---|---|
Liberal Democrats | Sue Alston* | 2,952 | 48.2 | –4.0 | |
Labour | Winko Kyaw Oo | 1,610 | 26.3 | –1.3 | |
Green | Judith Rutnam | 975 | 15.9 | +4.4 | |
Conservative | Thomas Wilson | 506 | 8.3 | +0.7 | |
TUSC | John Bunn | 78 | 1.3 | +0.1 | |
Majority | 1,342 | 21.9 | –2.7 | ||
Turnout | 6,121 | 46.8 | +0.5 | ||
Registered electors | 13,177 | ||||
Liberal Democrats hold | Swing | 1.4 | |||
Party | Candidate | Votes | % | ±% | |
---|---|---|---|---|---|
Green | Alexi Dimond* | 2,462 | 52.2 | +6.7 | |
Labour Co-op | Bethany Cheshire | 1,607 | 34.0 | –3.6 | |
Conservative | Brett Colk | 281 | 6.0 | –1.0 | |
Liberal Democrats | John Dryden | 238 | 5.0 | –1.2 | |
TUSC | Simon Jenkins | 132 | 2.8 | –0.9 | |
Majority | 855 | 18.1 | +10.2 | ||
Turnout | 4,720 | 35.3 | +0.9 | ||
Registered electors | 13,465 | ||||
Green hold | Swing | 5.2 | |||
Party | Candidate | Votes | % | ±% | |
---|---|---|---|---|---|
Labour | Rob Bannister | 1,954 | 36.4 | +0.7 | |
Liberal Democrats | Tariq Zaman | 1,856 | 34.5 | –5.6 | |
Green | Thomas Atkin–Withers | 1,043 | 19.4 | +5.0 | |
Conservative | Chris Garratt | 396 | 7.4 | –0.4 | |
TUSC | Liam Ball | 126 | 2.3 | +0.3 | |
Majority | 98 | 1.8 | N/A | ||
Turnout | 5,375 | 40.2 | –1.7 | ||
Registered electors | 13,458 | ||||
Labour gain from Liberal Democrats | Swing | 3.2 | |||
Party | Candidate | Votes | % | ±% | |
---|---|---|---|---|---|
Green | Christine Gilligan Kubo* | 2,726 | 51.3 | +5.2 | |
Labour | Bren Twomey | 1,763 | 33.2 | –5.3 | |
Conservative | Patricia Barnsley | 363 | 6.8 | –1.7 | |
Liberal Democrats | Chris Lynch | 213 | 4.0 | –1.0 | |
Heritage | John Hartley | 126 | 2.4 | N/A | |
TUSC | Leah Byatt | 118 | 2.2 | +0.4 | |
Majority | 963 | 18.1 | +10.5 | ||
Turnout | 5,309 | 36.2 | –0.2 | ||
Registered electors | 14,721 | ||||
Green hold | Swing | 5.3 | |||
Party | Candidate | Votes | % | ±% | |
---|---|---|---|---|---|
Labour Co-op | Elle Dodd | 1,881 | 57.6 | +13.7 | |
Green | Ruth Flagg–Abbey | 603 | 18.4 | –0.6 | |
Conservative | Seun Ajao | 308 | 9.4 | +0.4 | |
Independent | Craig Judson | 175 | 5.4 | +2.3 | |
Liberal Democrats | Stephanie Kenning | 170 | 5.2 | –2.1 | |
TUSC | Alistair Tice | 128 | 3.9 | –1.1 | |
Majority | 1,278 | 39.1 | N/A | ||
Turnout | 3,265 | 22.0 | +1.4 | ||
Registered electors | 14,938 | ||||
Labour Co-op hold | Swing | 7.2 | |||
Party | Candidate | Votes | % | ±% | |
---|---|---|---|---|---|
Labour | Tony Downing* | 2,035 | 49.0 | +11.8 | |
Liberal Democrats | Jonny Dixon | 1,523 | 36.7 | –6.4 | |
Conservative | Eve Millward | 415 | 10.0 | –2.0 | |
Green | Julie White | 150 | 3.6 | –1.6 | |
TUSC | Rory Smith | 28 | 0.7 | –1.8 | |
Majority | 512 | 12.3 | N/A | ||
Turnout | 4,151 | 31.2 | +0.4 | ||
Registered electors | 13,499 | ||||
Labour hold | Swing | 9.1 | |||
Party | Candidate | Votes | % | ±% | |
---|---|---|---|---|---|
Green | Maroof Raouf* | 2,662 | 40.8 | +3.2 | |
Labour Co-op | Derek Martin | 2,549 | 39.1 | –8.3 | |
Liberal Democrats | Nasar Raoof | 501 | 7.7 | –0.3 | |
Independent | Fayyaz Shah Ji | 381 | 5.8 | N/A | |
Conservative | John Chapman | 253 | 3.9 | –0.4 | |
TUSC | Bridget Gilbert | 172 | 2.6 | –0.1 | |
Majority | 113 | 1.7 | N/A | ||
Turnout | 6,581 | 42.9 | +0.7 | ||
Registered electors | 15,362 | ||||
Green hold | Swing | 5.8 | |||
Party | Candidate | Votes | % | ±% | |
---|---|---|---|---|---|
Labour | Mia Drazaic | 1,607 | 50.8 | +0.9 | |
Green | Billie Turner | 486 | 15.4 | –1.6 | |
Conservative | Richard Blyth | 467 | 14.8 | –3.8 | |
Liberal Democrats | Ann Kingdom | 273 | 8.6 | –1.2 | |
SDP | Annie Stoker | 175 | 5.5 | N/A | |
TUSC | Jack Jeffery | 153 | 4.8 | ±0.0 | |
Majority | 1,121 | 35.5 | +4.2 | ||
Turnout | 3,161 | 24.4 | +0.4 | ||
Registered electors | 13,090 | ||||
Labour gain from Independent | Swing | 1.3 | |||
Party | Candidate | Votes | % | ±% | |
---|---|---|---|---|---|
Labour | David Barker* | 1,728 | 53.7 | +1.4 | |
Reform UK | Brian Kus | 502 | 15.6 | +7.8 | |
Conservative | Christine Saunders | 401 | 12.5 | –5.3 | |
Green | Luke Hunt | 339 | 10.5 | +1.0 | |
Liberal Democrats | Adil Mohammed | 124 | 3.9 | –5.2 | |
TUSC | Sue Statter | 124 | 3.9 | +0.4 | |
Majority | 1,226 | 38.1 | +3.6 | ||
Turnout | 3,218 | 23.5 | +0.4 | ||
Registered electors | 13,798 | ||||
Labour hold | Swing | 3.2 | |||
Party | Candidate | Votes | % | ±% | |
---|---|---|---|---|---|
Labour Co-op | Mark Rusling | 1,547 | 54.5 | –5.8 | |
Conservative | Roger Barnsley | 434 | 15.3 | –3.8 | |
Green | Joel Gilbert | 387 | 13.6 | +2.4 | |
Independent | Tracy Booker | 202 | 7.1 | N/A | |
Liberal Democrats | Rachel Barker | 180 | 6.3 | –2.2 | |
TUSC | Patricia Prystupa | 88 | 3.1 | N/A | |
Majority | 1,113 | 39.2 | –2.0 | ||
Turnout | 2,838 | 20.9 | +1.2 | ||
Registered electors | 13,664 | ||||
Labour Co-op hold | Swing | 1.0 | |||
Party | Candidate | Votes | % | ±% | |
---|---|---|---|---|---|
Labour | Gareth Slater | 1,438 | 52.4 | –7.7 | |
Green | Andrew Hards | 376 | 13.7 | +2.4 | |
Conservative | Andrew Smith | 319 | 11.6 | –4.7 | |
Independent | Tony Damms* | 318 | 11.6 | N/A | |
Liberal Democrats | Kevin Grum | 196 | 7.1 | –1.2 | |
TUSC | Harry Lomas | 99 | 3.6 | –0.5 | |
Majority | 1,052 | 38.3 | –8.6 | ||
Turnout | 2,746 | 19.7 | ±0.0 | ||
Registered electors | 14,018 | ||||
Labour gain from Independent | Swing | 5.1 | |||
Party | Candidate | Votes | % | ±% | |
---|---|---|---|---|---|
Liberal Democrats | Richard Williams* | 1,959 | 40.2 | –12.2 | |
Labour Co-op | Lewis Blake Dagnall | 1,589 | 32.6 | +9.1 | |
Green | Chris Bragg | 692 | 14.2 | +4.8 | |
Conservative | Isaac Howarth | 521 | 10.7 | –2.6 | |
TUSC | Robert Simpson | 110 | 2.3 | +0.8 | |
Majority | 370 | 7.6 | –21.2 | ||
Turnout | 4,871 | 34.3 | –2.9 | ||
Registered electors | 14,304 | ||||
Liberal Democrats hold | Swing | 10.7 | |||
Party | Candidate | Votes | % | ±% | |
---|---|---|---|---|---|
Labour | Mark Whittaker | 2,399 | 49.6 | –1.7 | |
Conservative | Matthew Dixon | 1,341 | 27.7 | –6.6 | |
Green | David Willington | 607 | 12.5 | +5.0 | |
Liberal Democrats | Susan Davidson | 398 | 8.2 | +2.6 | |
TUSC | Claire Wraith | 95 | 2.0 | +1.1 | |
Majority | 1,058 | 21.9 | +4.9 | ||
Turnout | 4,840 | 33.7 | –2.4 | ||
Registered electors | 14,495 | ||||
Labour gain from Conservative | Swing | 2.5 | |||
Party | Candidate | Votes | % | ±% | |
---|---|---|---|---|---|
Labour Co-op | John Wright | 2,789 | 50.2 | –0.4 | |
Green | Dylan Lewis–Creser | 1,782 | 32.1 | –0.2 | |
Liberal Democrats | Alex Purvis | 332 | 5.8 | –0.5 | |
Conservative | Liam Neilson | 296 | 5.3 | +0.4 | |
TUSC | Isabelle France | 166 | 3.0 | ±0.0 | |
Heritage | Tim Grindley | 132 | 2.4 | N/A | |
Communist | Ben Ughetti | 69 | 1.2 | N/A | |
Majority | 1,007 | 18.8 | +0.4 | ||
Turnout | 5,365 | 37.5 | +1.1 | ||
Registered electors | 14,925 | ||||
Labour Co-op gain from Green | Swing | 0.1 | |||
Party | Candidate | Votes | % | ±% | |
---|---|---|---|---|---|
Liberal Democrats | Ann Whitaker* | 1,662 | 40.4 | –4.8 | |
Labour Co-op | Tom Blandford | 1,584 | 38.5 | +8.4 | |
Conservative | Scott Darby | 465 | 11.3 | +1.8 | |
Green | Kathy Aston | 288 | 7.0 | +1.5 | |
TUSC | Christie Littlewood | 112 | 2.7 | +1.4 | |
Majority | 78 | 1.9 | –13.2 | ||
Turnout | 4,111 | 30.8 | ±0.0 | ||
Registered electors | 13,463 | ||||
Liberal Democrats hold | Swing | 6.6 | |||
Party | Candidate | Votes | % | ±% | |
---|---|---|---|---|---|
Labour Co-op | Mick Rooney* | 1,810 | 57.8 | +2.3 | |
Conservative | Mary Love | 453 | 14.5 | –6.4 | |
Green | Hannah Nicklin | 311 | 9.9 | +0.5 | |
Independent | Jack Carrington | 272 | 8.7 | N/A | |
Liberal Democrats | Charles Edwardson | 195 | 6.2 | –3.3 | |
TUSC | Joshua Crapper | 89 | 2.8 | –1.8 | |
Majority | 1,357 | 43.4 | +8.8 | ||
Turnout | 3,130 | 24.6 | +0.4 | ||
Registered electors | 12,780 | ||||
Labour Co-op hold | Swing | 4.4 | |||
Sheffield Hallam is a constituency represented in the House of Commons of the UK Parliament since 2019 by Olivia Blake of the Labour Party.
Sheffield City Council is the local authority for the City of Sheffield, a metropolitan borough with city status in South Yorkshire, England. The council consists of 84 councillors, elected to represent 28 wards, each with three councillors. It is currently under no overall control, with Labour, the Liberal Democrats and the Green Party each holding chair positions in a proportionate number of committees.
Sefton Council is the governing body for the Metropolitan Borough of Sefton in the ceremonial county of Merseyside, in North West England. The council was under no overall control from the 1980s until 2012 when the Labour Party took control. It is a constituent council of Liverpool City Region Combined Authority.
Sheffield City Council elections took place on Thursday 6 May 2010. There were 28 seats up for election in 2010, one of the three councillors from each ward. Since the previous election, Liberal Democrat councillor Frank Taylor had defected to an Independent leaving the Liberal Democrats with 44 councillors. Turnout was up dramatically with it being held alongside the general election, to 62.6%. The higher turnout helped mainly Labour against their electoral rivals, who managed to return the council to no overall control with three gains. This was bolstered by the newly elected Liberal Democrat in Walkley defecting to Labour immediately after being elected.
Elections to Preston City Council took place on 3 May 2012, the same day as other 2012 United Kingdom local elections.
Sheffield City Council elections took place on Thursday 5 May 2016, alongside nationwide local elections. All 84 seats were up for election, 3 per ward, after several electoral boundaries were changed. Labour, the Liberal Democrats and the Green Party contested all 84 seats. The Conservatives fielded 55 candidates, UKIP 43, TUSC 23 and Yorkshire First 1. There was also 1 independent candidate. Voters in the Sheffield Brightside and Hillsborough Parliamentary constituency also elected Gill Furniss MP, in a by-election triggered by the death of her husband Harry Harpham MP.
The 2016 Exeter City Council election took place on 5 May 2016, to elect members of Exeter City Council in England. Following boundary changes, the entire council was up for election, and all 13 wards were contested, each electing three councillors. The election was held concurrently with other local elections held in England on the 5 May.
The 2018 Oxford City Council election took place on 3 May 2018, to elect 24 of the 48 members of Oxford City Council in England. This was on the same day as other local elections in England. Each of Oxford's 24 wards elected one councillor, with the other seat in each ward next due for election in May 2020.
Elections to Manchester City Council were held on 2 May 2019, as part of the 2019 United Kingdom local elections. In 2018 Labour retained its majority of the council with 94 seats to the Liberal Democrats making up the opposition of 2, led by former MP John Leech.
Elections to Sheffield City Council were held on Thursday 2 May 2019; one of a number of local council elections taking place across England and Northern Ireland on the same day. One of each ward's three seats was up for election, having last been contested in the 2016 elections.
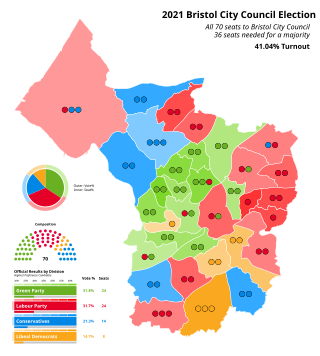
The 2021 Bristol City Council election took place on 6 May 2021 to elect members of Bristol City Council in England. It coincided with nationwide local elections. Voters in the city also voted for the mayor of Bristol, the mayor of the West of England and for Avon and Somerset's police and crime commissioner. The election was originally due to take place in May 2020, but was postponed due to the COVID-19 pandemic.
The 2021 Sunderland City Council election took place on 6 May 2021 to elect members of Sunderland City Council in England on the same day as other elections across the United Kingdom.
The 2022 Birmingham City Council election took place on 5 May 2022, with all 101 council seats up for election across 37 single-member and 32 two-member wards. The election was held alongside other local elections across Great Britain and town council elections in Sutton Coldfield.
The 2022 Lambeth London Borough Council election took place on 5 May 2022. All 63 members of Lambeth London Borough Council were elected. The elections took place alongside local elections in the other London boroughs and elections to local authorities across the United Kingdom.
The 2022 Cardiff Council election took place on 5 May 2022 to elect 79 members to Cardiff Council. On the same day, elections were held to the other 21 local authorities and to community councils in Wales as part of the 2022 Welsh local elections.
Elections to The Highland Council were held on 5 May 2022, the same day as the 31 other Scottish local government elections. As with other Scottish council elections, it was held using single transferable vote (STV) – a form of proportional representation – in which multiple candidates are elected in each ward and voters rank candidates in order of preference.
The 2022 Calderdale Metropolitan Borough Council election took place on 5 May 2022 to elect members of Calderdale Metropolitan Borough Council in England. One third of councillors — 17 out of 51, plus one vacancy in Ovenden ward were up for election. The election took place alongside other local elections across the United Kingdom.
Elections to the City of Edinburgh Council took place on 5 May 2022 on the same day as the 31 other Scottish local government elections. As with other Scottish council elections, it was held using single transferable vote (STV) – a form of proportional representation – in which multiple candidates are elected in each ward and voters rank candidates in order of preference.
Elections to Colchester Borough Council took place on 5 May 2022. Eighteen members of the council were elected: one from 16 of the 17 wards, and two councillors from New Town & Christ Church ward, following the death of incumbent councillor Nick Cope, elected in 2019 and due to serve until 2023.