| |||||||||||||||||||||||||||||||||||||||||||||||||||
| |||||||||||||||||||||||||||||||||||||||||||||||||||
25 of 75 seats on Sunderland City Council 38 seats needed for a majority | |||||||||||||||||||||||||||||||||||||||||||||||||||
---|---|---|---|---|---|---|---|---|---|---|---|---|---|---|---|---|---|---|---|---|---|---|---|---|---|---|---|---|---|---|---|---|---|---|---|---|---|---|---|---|---|---|---|---|---|---|---|---|---|---|---|
| |||||||||||||||||||||||||||||||||||||||||||||||||||
Winner of each seat at the 2024 Sunderland City Council election | |||||||||||||||||||||||||||||||||||||||||||||||||||
|
The 2024 Sunderland City Council election took place on 2 May 2024 to elect members of Sunderland City Council. 25 of the 75 seats of the council were up for election. The election took place at the same time as other local elections across England.
The Labour Party remained in control of the council and the Liberal Democrats returned as the majority opposition party. [1] After the election Labour’s National Executive Committee (NEC) appointed Michael Mordey as Group Leader replacing Gramme Miller who has led the council since 2018. The Lib Dem group leader Paul Edgeworth said it was "bad news" for Sunderland, adding: "Labour’s London and Newcastle HQs have clearly imposed a yes man for Keir Starmer and a yes man for Kim McGuinness." [2]
25 of the 75 seats will be up for election, the last time councillors will be elected using the boundaries set in 2004. [3]
Since the first election in 1973, Sunderland has been a strongly Labour council, which consistently achieves over 60% control of the council. [4] However, in recent years they have lost seats to the Conservatives, UKIP and the Liberal Democrats. The seats up for election this year were last elected in 2021. In that election, Labour lost 9 seats, the Conservatives gained 6 and the Liberal Democrats gained 4.
Since the last election, three councillors defected from the Liberal Democrats, two to Labour and one became an independent. A Labour councillor (elected as a Conservative) now sits as an independent councillor after being accused of forcing a woman to marry. [5]
2024 Sunderland City Council election | ||||||||||
---|---|---|---|---|---|---|---|---|---|---|
Party | This election | Full council | This election | |||||||
Seats | Net | Seats % | Other | Total | Total % | Votes | Votes % | +/− | ||
Labour | 18 | 6 | 72.0 | 35 | 53 | 70.7 | 29,446 | 45.4 | +0.1 | |
Liberal Democrats | 4 | 1 | 16.0 | 8 | 12 | 16 | 9,950 | 15.3 | -1.8 | |
Conservative | 3 | 5 | 4.0 | 7 | 10 | 13.3 | 11,773 | 18.2 | -4.4 | |
Reform UK | 0 | - | 0.0 | 0 | 0 | 0.0 | 9,377 | 14.5 | +7.8 | |
Green | 0 | - | 0.0 | 0 | 0 | 0.0 | 3,355 | 5.2 | -0.4 | |
Independent | 0 | - | 0.0 | 0 | 0 | 0.0 | 957 | 1.5 | -1.3 | |
An asterisk next to a candidate's name denotes an incumbent councillor.
Party | Candidate | Votes | % | ±% | |
---|---|---|---|---|---|
Labour Co-op | Fiona Tobin | 1,191 | 39.8 | -0.5 | |
Conservative | Richard Dunn* | 1,019 | 34.1 | -1.7 | |
Reform UK | Alan Bilton | 415 | 13.9 | +4.5 | |
Liberal Democrats | Tim Ellis-Dale | 203 | 6.8 | -1.1 | |
Green | Mark Tyers | 162 | 5.4 | -1.3 | |
Majority | 172 | ||||
Turnout | 2,990 | ||||
Labour Co-op gain from Conservative | Swing | ||||
Party | Candidate | Votes | % | ±% | |
---|---|---|---|---|---|
Labour | Denny Wilson* | 1,130 | 62.9 | -2.1 | |
Reform UK | Keith Samme | 346 | 19.3 | +9.0 | |
Conservative | Christopher Rose | 160 | 8.9 | -4.7 | |
Liberal Democrats | Mia Coupland | 98 | 5.5 | -1.1 | |
Green | Dawn Jackson | 62 | 3.5 | -1.1 | |
Majority | 784 | 43.7 | |||
Turnout | 1,796 | ||||
Labour hold | Swing | ||||
Party | Candidate | Votes | % | ±% | |
---|---|---|---|---|---|
Labour | Kevin Johnston* | 1,432 | 57.4 | +6.6 | |
Reform UK | Michael John Lorraine | 395 | 15.8 | +11.9 | |
Conservative | Benjamin Davies-Scott | 316 | 12.7 | -1.8 | |
Green | Andrew Robertson | 245 | 9.8 | +4.9 | |
Liberal Democrats | Nana Boddy | 105 | 4.2 | +0.9 | |
Majority | 1,037 | 41.6 | |||
Turnout | 2,493 | ||||
Labour hold | Swing | ||||
Party | Candidate | Votes | % | ±% | |
---|---|---|---|---|---|
Liberal Democrats | Paul Gibson* | 1,441 | 49.3 | -9.9 | |
Labour | Liz Highmore | 831 | 28.4 | +4.6 | |
Reform UK | Susan Lathan | 359 | 12.3 | +7.5 | |
Conservative | George Brown | 200 | 6.8 | -3.2 | |
Green | Martha Bradly | 94 | 3.2 | +1.0 | |
Majority | 610 | 20.9 | |||
Turnout | 2,925 | ||||
Liberal Democrats hold | Swing | ||||
Party | Candidate | Votes | % | ±% | |
---|---|---|---|---|---|
Conservative | Michael Hartnack* | 1,379 | 35.8 | +9.3 | |
Liberal Democrats | Miguel Smith | 1,234 | 32.0 | -16.1 | |
Labour | Andy Stafford | 791 | 20.6 | +2.2 | |
Reform UK | Lisa Marie Hilton | 303 | 7.9 | +4.7 | |
Green | Kevin Lynch | 127 | 3.3 | +0.5 | |
Majority | 145 | 3.8 | |||
Turnout | 3,848 | 43.3 | |||
Conservative hold | Swing | ||||
Party | Candidate | Votes | % | ±% | |
---|---|---|---|---|---|
Labour | Stephen Lewis Elms | 976 | 39.6 | -4.0 | |
Liberal Democrats | Ciaran Morrissey* | 948 | 38.4 | -4.6 | |
Reform UK | Lynda Andrews | 258 | 10.5 | +6.2 | |
Conservative | Georgina Gould | 144 | 5.8 | +0.6 | |
Green | Helmut Izaks | 125 | 5.0 | +1.1 | |
Majority | 28 | 1.1 | |||
Turnout | 2,466 | 27.5 | |||
Labour gain from Liberal Democrats | Swing | ||||
Party | Candidate | Votes | % | ±% | |
---|---|---|---|---|---|
Labour Co-op | James Blackburn* | 1,153 | 46.6 | +1.7 | |
Independent | David Geddis | 721 | 29.2 | -3.5 | |
Reform UK | Stephen Holt | 269 | 10.9 | +4.6 | |
Conservative | Connor Sinclair | 145 | 5.9 | -2.5 | |
Green | Rachel Lowe | 123 | 5.0 | +1.9 | |
Liberal Democrats | Ian Ellis | 62 | 2.5 | -1.1 | |
Majority | 432 | ||||
Turnout | 2,473 | ||||
Labour Co-op hold | Swing | ||||
Party | Candidate | Votes | % | ±% | |
---|---|---|---|---|---|
Labour | John Price* | 1,692 | 61.4 | +1.3 | |
Reform UK | Lynda Alexander | 379 | 13.8 | +6.2 | |
Conservative | Craig Morrison | 249 | 9.0 | -4.4 | |
Independent | Donna Thomas | 236 | 8.6 | -1.3 | |
Green | Alyson Kordbarlag | 106 | 3.8 | -0.4 | |
Liberal Democrats | Sharon Boddy | 93 | 3.4 | -1.3 | |
Majority | 1,313 | ||||
Turnout | 2,755 | ||||
Labour hold | Swing | ||||
Party | Candidate | Votes | % | ±% | |
---|---|---|---|---|---|
Liberal Democrats | Niall Hodson* | 1,450 | 56.0 | -0.3 | |
Labour | Syed Ali | 742 | 28.6 | -4.2 | |
Reform UK | Kathryn Brown | 156 | 6.0 | +3.8 | |
Green | Richard Bradley | 118 | 4.6 | +1.9 | |
Conservative | Hardipsinh Barad | 110 | 4.2 | -0.8 | |
Majority | 708 | 27.3 | |||
Turnout | 2,590 | 32.1 | |||
Liberal Democrats hold | Swing | ||||
Party | Candidate | Votes | % | ±% | |
---|---|---|---|---|---|
Liberal Democrats | Steven Donkin | 1,147 | 48.2 | -16.1 | |
Labour | Karren Boble | 869 | 36.5 | +8.8 | |
Reform UK | Raymond Lathan | 255 | 10.7 | +7.8 | |
Conservative | Gwennyth Gibson | 73 | 3.1 | -0.5 | |
Green | Dorothy Lynch | 38 | 1.6 | +0.1 | |
Majority | 278 | 11.7 | |||
Turnout | 2,382 | ||||
Liberal Democrats hold | Swing | ||||
Party | Candidate | Votes | % | ±% | |
---|---|---|---|---|---|
Labour Co-op | Alison Smith* | 931 | 51.9 | -7.4 | |
Reform UK | Chris Eynon | 579 | 32.3 | +17.0 | |
Conservative | Susan Leishman | 156 | 8.7 | -3.9 | |
Liberal Democrats | Steve Dale | 128 | 7.1 | -0.7 | |
Majority | 352 | 19.6 | |||
Turnout | 1,794 | ||||
Labour Co-op hold | Swing | ||||
Party | Candidate | Votes | % | ±% | |
---|---|---|---|---|---|
Labour | Helen Glancy | 1,356 | 53.7 | +2.2 | |
Reform UK | Tony Thomposon | 656 | 26.0 | +12.0 | |
Conservative | Kevin Leonard | 345 | 13.7 | -9.0 | |
Liberal Democrats | Janice Ellis | 167 | 6.6 | +1.2 | |
Majority | 700 | 27.7 | |||
Turnout | 2,524 | ||||
Labour hold | Swing | ||||
Party | Candidate | Votes | % | ±% | |
---|---|---|---|---|---|
Liberal Democrats | Paul Edgeworth* | 1,318 | 60.5 | -3.5 | |
Labour | Dennis Carroll | 543 | 24.9 | +0.4 | |
Reform UK | Brain Alexander | 215 | 9.9 | +5.5 | |
Conservative | Adam Aiston | 60 | 2.8 | -1.8 | |
Green | Welsh Robert | 42 | 1.9 | -0.7 | |
Majority | 775 | 35.6 | |||
Turnout | 2,178 | ||||
Liberal Democrats hold | Swing | ||||
Party | Candidate | Votes | % | ±% | |
---|---|---|---|---|---|
Labour Co-op | Katherine Mason-Gage* | 1,605 | 57.9 | +4.1 | |
Reform UK | Robert Snowdon | 466 | 16.8 | +10.5 | |
Conservative | Christine Reed | 358 | 12.9 | -8.3 | |
Green | Thomas Mower | 252 | 9.1 | -2.0 | |
Liberal Democrats | Michael Peacock | 89 | 3.2 | -1.7 | |
Majority | 1,139 | 41.1 | |||
Turnout | 2,770 | ||||
Labour hold | Swing | ||||
Party | Candidate | Votes | % | ±% | |
---|---|---|---|---|---|
Labour | Sophie Clinton | 1,322 | 51.9 | -4.3 | |
Green | Rachel Featherstone | 551 | 21.6 | +8.3 | |
Reform UK | Michael Ellis | 380 | 14.9 | +6.5 | |
Conservative | Owen Snaith | 243 | 9.5 | -9.5 | |
Liberal Democrats | Mauro Amatosi | 50 | 2.0 | -1.0 | |
Majority | 771 | 30.3 | |||
Turnout | 2,546 | ||||
Labour hold | Swing | ||||
Party | Candidate | Votes | % | ±% | |
---|---|---|---|---|---|
Labour | Kelly Chequer* | 1,141 | 55.0 | -5.2 | |
Reform UK | James Wilson | 453 | 21.8 | +9.8 | |
Conservative | Bryan Reynolds | 227 | 10.9 | -6.3 | |
Green | Christopher Crozier | 139 | 6.7 | +0.2 | |
Liberal Democrats | Michael Dagg | 115 | 5.5 | +1.5 | |
Majority | 688 | 33.2 | |||
Turnout | 2,075 | ||||
Labour hold | Swing | ||||
Party | Candidate | Votes | % | ±% | |
---|---|---|---|---|---|
Labour Co-op | Lynne Dagg | 869 | 38.9 | -9.6 | |
Conservative | Greg Peacock* | 429 | 19.2 | -15.1 | |
Reform UK | Sam Wood-Brass | 420 | 18.8 | N/A | |
Green | Simion Hughes | 419 | 18.8 | +12.3 | |
Liberal Democrats | Audrey Smith | 96 | 4.3 | -6.4 | |
Majority | 440 | 19.7 | |||
Turnout | 2,233 | ||||
Labour Co-op gain from Conservative | Swing | ||||
Party | Candidate | Votes | % | ±% | |
---|---|---|---|---|---|
Conservative | Christopher Burnicle* | 1,102 | 45.8 | -4.4 | |
Labour Co-op | Andrew Rowntree | 833 | 34.6 | +0.2 | |
Reform UK | Shelia Samme | 254 | 10.5 | +4.2 | |
Green | Scott Burrows | 113 | 4.7 | -0.1 | |
Liberal Democrats | Anthony Usher | 106 | 4.4 | +0.1 | |
Majority | 269 | 11.2 | |||
Turnout | 2,408 | ||||
Conservative hold | Swing | ||||
Party | Candidate | Votes | % | ±% | |
---|---|---|---|---|---|
Conservative | Lyall Reed* | 1,525 | 45.7 | +3.5 | |
Labour | Jo Cooper | 1,201 | 36.0 | -4.6 | |
Reform UK | Neil Farrer | 270 | 8.1 | +0.1 | |
Green | John Appleton | 242 | 7.2 | +1.3 | |
Liberal Democrats | Colin Wilson | 102 | 3.1 | -0.1 | |
Majority | 324 | 9.7 | |||
Turnout | 3,340 | ||||
Conservative hold | Swing | ||||
Party | Candidate | Votes | % | ±% | |
---|---|---|---|---|---|
Labour Co-op | David Newey | 1,167 | 38.3 | +1.0 | |
Conservative | Sam Johnston* | 1,074 | 35.2 | -8.2 | |
Reform UK | David Craig | 411 | 13.5 | +8.6 | |
Liberal Democrats | John Lennox | 255 | 8.4 | +0.2 | |
Green | Liam Dufferwiel | 143 | 4.7 | -1.5 | |
Majority | 93 | 3.1 | |||
Turnout | 3,050 | ||||
Labour Co-op gain from Conservative | Swing | ||||
Party | Candidate | Votes | % | ±% | |
---|---|---|---|---|---|
Labour Co-op | Dianne Elizabeth Snowdon* | 1,673 | 62.9 | -3.7 | |
Conservative | Audrey Jaitay | 445 | 16.7 | -1.9 | |
Reform UK | Aimee Trow | 320 | 12.0 | +6.2 | |
Green | Raymond Moore | 133 | 5.0 | -0.3 | |
Liberal Democrats | Linda Wood | 90 | 3.4 | -0.2 | |
Majority | 1,228 | 46.2 | |||
Turnout | 2,661 | ||||
Labour Co-op hold | Swing | ||||
Party | Candidate | Votes | % | ±% | |
---|---|---|---|---|---|
Labour Co-op | Sean Laws* | 1,632 | 56.6 | +0.2 | |
Conservative | Hilary Johnson | 550 | 19.1 | -7.5 | |
Reform UK | Ashton Muncaster | 466 | 16.2 | +9.0 | |
Liberal Democrats | Crispin Welby | 233 | 8.1 | +3.9 | |
Majority | 1,082 | 37.5 | |||
Turnout | 2,881 | ||||
Labour Co-op hold | Swing | ||||
Party | Candidate | Votes | % | ±% | |
---|---|---|---|---|---|
Labour | Michael Walker* | 1,398 | 64.2 | -4.0 | |
Reform UK | Elizabeth Brown | 478 | 21.9 | +14.3 | |
Conservative | Svetlana Rakhimova | 179 | 8.2 | -4.7 | |
Liberal Democrats | Carlton West | 123 | 5.6 | +0.5 | |
Majority | 920 | 42.3 | |||
Turnout | 2,178 | ||||
Labour hold | Swing | ||||
Party | Candidate | Votes | % | ±% | |
---|---|---|---|---|---|
Labour Co-op | Brandon Mark Feeley | 1,555 | 51.7 | +8.1 | |
Conservative | Peter Noble | 890 | 29.6 | -10.7 | |
Reform UK | Paul Donaghy* | 382 | 12.7 | +5.1 | |
Green | Michal Chantowski | 96 | 3.2 | -1.5 | |
Liberal Democrats | Sean Terry | 82 | 2.7 | -1.1 | |
Majority | 665 | 22.1 | |||
Turnout | 3,005 | ||||
Labour Co-op gain from Reform UK | Swing | ||||
Party | Candidate | Votes | % | ±% | |
---|---|---|---|---|---|
Labour Co-op | Jimmy Warne* | 1,412 | 51.6 | -5.2 | |
Reform UK | Deborah Lorraine | 492 | 18.0 | +12.6 | |
Conservative | Samantha Cosgrove | 395 | 14.4 | -6.7 | |
Green | Paul Andrew Leonard | 225 | 8.2 | -0.2 | |
Liberal Democrats | Andy Bex | 215 | 7.8 | -0.4 | |
Majority | 920 | 33.6 | |||
Turnout | 2,739 | ||||
Labour Co-op hold | Swing | ||||
Aberdeen City Council is the local government authority for the city of Aberdeen, Scotland. It was created in 1996, under the Local Government etc. (Scotland) Act 1994, though a sense of Aberdeen as a city, with its own city council, can be traced back to 1900, when the county of the city of Aberdeen was created.
Sunderland City Council elections are generally held three years out of every four, with a third of the council being elected each time. Sunderland City Council is the local authority for the metropolitan borough of the City of Sunderland in Tyne and Wear, England. Since the last boundary changes in 2004, 75 councillors have been elected from 25 wards.
The 2004 Sunderland City Council election took place on 10 June 2004 to elect members of Sunderland City Council Council in Tyne and Wear, England. The whole council was up for election following boundary changes since the last election in 2003. The Labour Party stayed in overall control of the council.
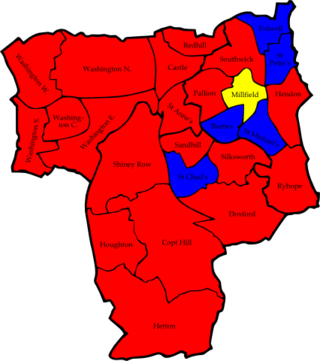
The 2006 Sunderland Council election took place on 4 May 2006 to elect members of Sunderland City Council in Tyne and Wear, England. One third of the Council was up for election and the Labour Party stayed in overall control.
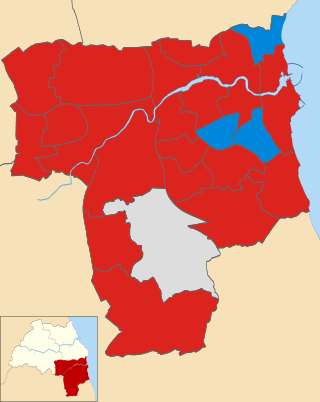
The 2008 Sunderland Council election took place on 1 May 2008 to elect members of Sunderland Metropolitan Borough Council in Tyne and Wear, England. One third of the council was up for election and the Labour Party stayed in overall control of the council.
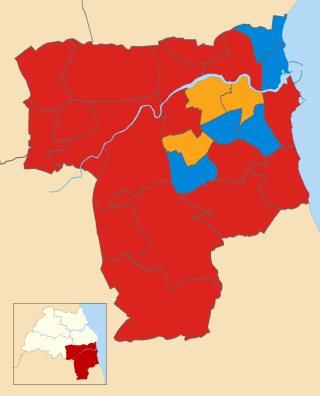
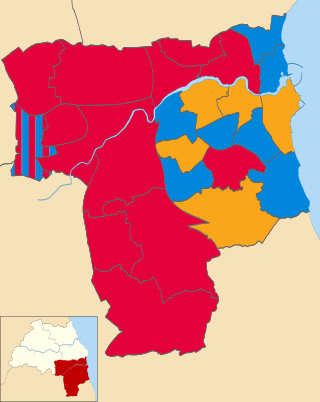
The 2010 Sunderland Council election took place on 6 May 2010 to elect members of Sunderland Metropolitan Borough Council in Tyne and Wear, England. One third of the council was up for election and the Labour Party stayed in overall control of the council. The election took place on the same day as the 2010 General Election.
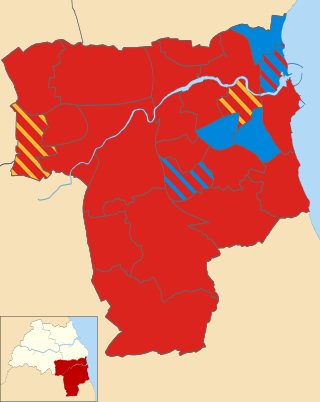
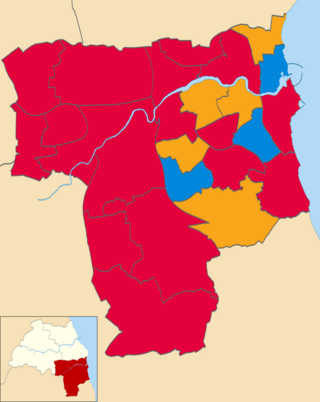
The 2011 Sunderland Council election took place on 5 May 2011 to elect members of Sunderland Metropolitan Borough Council in Tyne and Wear, England. One third of the council was up for election and the Labour Party stayed in overall control of the council.
The 2014 Pendle Borough Council election took place on 22 May 2014 to elect members of Pendle Borough Council in Lancashire, England. One third of the council was up for election and the council stayed under no overall control.
The 2012 Carlisle City Council election took place on 3 May 2012 to elect members of Carlisle District Council in Cumbria, England. One third of the council was up for election and the Labour Party gained overall control of the council from no overall control.
The 2018 Sunderland City Council election took place on 3 May 2018 to elect members of Sunderland City Council in England. The election took place on the same day as other local elections.
The 2021 United Kingdom local elections were held on Thursday 6 May 2021. More than 145 English local councils, around 5,000 councillor seats, thirteen directly elected mayors in England, and 39 police and crime commissioners in England and Wales were contested. On the same day, the 2021 Hartlepool by-election took place, and there were also elections to the Scottish Parliament, Senedd and London Assembly, the last in conjunction with the London mayoral election.
Elections to Portsmouth City Council took place on Thursday 2 May 2019, alongside other local elections across the country. The seats contested in this election were last contested in 2015. The Conservative Party had 8 seats they were defending, the Liberal Democrats 5 and Labour 1 seat. A by-election occurred within the vacant Cosham seat from last years election, due to the sitting Conservative standing down. No party gained a majority from this election, and therefore the council remains under no overall control.
The 2019 Sunderland City Council election took place on 2 May 2019 to elect members of Sunderland City Council in England. The election took place on the same day as other local elections.
The 2021 Oxfordshire County Council election took place on 6 May 2021 alongside the other local elections. All 63 seats of the Oxfordshire County Council were contested. The council is composed of 61 divisions, each electing either one or two councillors, all elected by FPTP.
The 2021 Sunderland City Council election took place on 6 May 2021 to elect members of Sunderland City Council in England on the same day as other elections across the United Kingdom.
The 2022 Birmingham City Council election took place on 5 May 2022, with all 101 council seats up for election across 37 single-member and 32 two-member wards. The election was held alongside other local elections across Great Britain and town council elections in Sutton Coldfield.
The 2022 Sunderland City Council election took place on 5 May 2022 to elect members of Sunderland City Council. This is on the same day as other elections across the United Kingdom.
The 2023 United Kingdom local elections were held on Thursday, 4 May 2023 in England and on Thursday 18 May 2023 in Northern Ireland. These included district councils, unitary authorities, and directly elected mayors in England, and included all local councils in Northern Ireland. Notably, these elections were the first to be held under the Elections Act 2022, a new voter identification law that required voters to show photo ID when attending a polling station, and was a cause for controversy.
The 2023 Sunderland City Council election took place on 4 May 2023 to elect members of Sunderland City Council. There were 25 of the 75 seats of the council up for election, being the usual third of the council. The election took place at the same time as other local elections across England.
The 2024 United Kingdom local elections took place on 2 May 2024 to choose 2,658 councillors on 107 councils in England, 11 directly elected mayors in England, the 25 members of the London Assembly, and 37 police and crime commissioners in England and Wales. The 2024 Blackpool South parliamentary by-election was held on the same day.