| ||||||||||||||||||||||||||||||||||||||||||||||||||||||||||||||
All 35 seats to Worcester City Council 18 seats needed for a majority | ||||||||||||||||||||||||||||||||||||||||||||||||||||||||||||||
---|---|---|---|---|---|---|---|---|---|---|---|---|---|---|---|---|---|---|---|---|---|---|---|---|---|---|---|---|---|---|---|---|---|---|---|---|---|---|---|---|---|---|---|---|---|---|---|---|---|---|---|---|---|---|---|---|---|---|---|---|---|---|
| ||||||||||||||||||||||||||||||||||||||||||||||||||||||||||||||
Winner of each seat at the 2024 Worcester City Council election | ||||||||||||||||||||||||||||||||||||||||||||||||||||||||||||||
|
The 2024 Worcester City Council election was held on Thursday 2 May 2024, alongside the other local elections in the United Kingdom being held on the same day. All 35 members of Worcester City Council in Worcestershire were elected following boundary changes. The council remained under no overall control.
Worcester has been controlled by both the Conservatives and Labour for long periods. From 1980 to 1999, Labour held a majority on the council. [1] The Conservatives then held a majority from 2003 to 2008 after a period of no overall control, and again from 2011 to 2012. [2]
The Conservatives regained control in 2015, but the council reverted to no overall control a year later; [3] 2021 to 2022 was also a period of Conservative majority. [4] [5] In the previous election, the Green Party gained 5 seats with 28.4% of the vote, Labour gained 1 with 28.0%, the Liberal Democrats gained 2 with 16.3%, and the Conservatives lost all the seats they were defending with 25.4%. Following the 2023 election, Labour and the Green Party formed a coalition, with the party leaders serving as joint leaders of the council. [6] The Green leader, Marjory Bisset, did not stand for re-election in 2024. [7]
Worcester formerly elected its councillors in thirds, on a 4-year cycle. The 2024 election saw both a review of ward boundaries and a change to elections being held for all councillors every four years instead. All councillors were therefore elected to the new wards. [8]
Old wards [9] | No. of seats | New wards | No. of seats |
---|---|---|---|
Arboretum | 2 | Arboretum | 2 |
Battenhall | 2 | Battenhall | 2 |
Bedwardine | 3 | Cathedral | 2 |
Cathedral | 3 | Claines | 3 |
Claines | 3 | Dines Green and Grove Farm | 2 |
Gorse Hill | 2 | Fort Royal | 2 |
Nunnery | 3 | Leopard Hill | 2 |
Rainbow Hill | 2 | Lower Wick and Pitmaston | 2 |
St Clement | 2 | Nunnery | 3 |
St John | 3 | Rainbow Hill | 2 |
St Peter's Parish | 2 | St Clement | 2 |
St Stephen | 2 | St John's | 2 |
Warndon | 2 | St Nicholas | 2 |
Warndon Parish North | 2 | St Peter's Parish | 2 |
Warndon Parish South | 2 | St Stephen | 2 |
Warndon and Elbury Park | 3 |
After 2023 election | Before 2024 election [10] | After 2024 election | ||||||
---|---|---|---|---|---|---|---|---|
Party | Seats | Party | Seats | Party | Seats | |||
Labour | 13 | Labour | 13 | Labour | 17 | |||
Green | 10 | Green | 11 | Green | 12 | |||
Conservative | 8 | Conservative | 7 | Conservative | 1 | |||
Liberal Democrats | 4 | Liberal Democrats | 4 | Liberal Democrats | 5 |
Changes 2023–2024:
Councillor | Ward | First elected | Party | Date announced | |
---|---|---|---|---|---|
Simon Geraghty | St Clement | 2000 | Conservative | 13 April 2024 [15] | |
Marjory Bisset | Green | [7] | |||
2024 Worcester City Council election | ||||||||||
---|---|---|---|---|---|---|---|---|---|---|
Party | Candidates | Seats | Gains | Losses | Net gain/loss | Seats % | Votes % | Votes | +/− | |
Labour | 35 | 17 | 4 | 0 | 4 | 48.6 | 29.5 | 16,203 | +1.5 | |
Green | 35 | 12 | 1 | 0 | 1 | 34.3 | 32.9 | 18,092 | +4.5 | |
Liberal Democrats | 23 | 5 | 1 | 0 | 1 | 14.3 | 14.3 | 7,894 | -2.0 | |
Conservative | 35 | 1 | 0 | 6 | 6 | 2.9 | 20.1 | 11,082 | -5.3 | |
Independent | 7 | 0 | 0 | 0 | 0 | 2.3 | 1,288 | +1.8 | ||
Reform UK | 2 | 0 | 0 | 0 | 0 | 0.5 | 294 | +0.3 | ||
TUSC | 5 | 0 | 0 | 0 | 0 | 0.4 | 206 | -0.1 | ||
UKIP | 1 | 0 | 0 | 0 | 0 | 0.1 | 68 | +0.1 |
Following the election, Labour formed a minority administration. Their leader Lynn Denham, who had been one of two joint leaders before the election, was appointed sole leader of the council at the subsequent annual council meeting on 14 May 2024. [16]
The Statement of Persons Nominated, which details the candidates standing in each ward, was released by Worcester Council following the close of nominations on 8 April 2024. [17] Sitting councillors standing for re-election are marked with an asterisk (*).
Party | Candidate | Votes | % | ±% | |
---|---|---|---|---|---|
Green | Hannah Cooper* | 1,183 | 67.2 | ||
Green | Karen Lewing* | 1,090 | 61.9 | ||
Labour | Andrew Tull | 314 | 17.8 | ||
Labour | Nazrul Haque | 261 | 14.8 | ||
Conservative | Zoe Coldicott | 151 | 8.6 | ||
Conservative | Angela Stanley | 120 | 6.8 | ||
Liberal Democrats | Jon Taylor | 106 | 6.0 | ||
Liberal Democrats | Alison Morgan | 94 | 5.3 | ||
TUSC | Calvin Fowler | 33 | 1.9 | ||
Turnout | 1,761 | 36.70 | |||
Registered electors | 4,798 | ||||
Green hold | |||||
Green hold | |||||
Party | Candidate | Votes | % | ±% | |
---|---|---|---|---|---|
Green | Louis Stephen* | 1,367 | 71.6 | ||
Green | Paul Sobczyk | 1,213 | 63.5 | ||
Labour | Graham Taylor | 322 | 16.9 | ||
Labour | Ian Benfield | 306 | 16.0 | ||
Conservative | Parveen Akhtar | 300 | 15.7 | ||
Conservative | Naseeb Hussain | 253 | 13.2 | ||
Liberal Democrats | Pyers Symon | 59 | 3.1 | ||
Turnout | 2,022 | 43.1 | |||
Registered electors | 4,690 | ||||
Green hold | |||||
Green hold | |||||
Party | Candidate | Votes | % | ±% | |
---|---|---|---|---|---|
Labour | Lynn Denham* | 644 | 45.4 | ||
Labour | Adam Scott | 541 | 38.1 | ||
Green | Jon Bodenham | 525 | 37.0 | ||
Green | Leisa Taylor | 464 | 32.7 | ||
Conservative | Adele Rimell | 225 | 15.9 | ||
Conservative | Chris Rimell | 216 | 15.2 | ||
Independent | Francis Lankester | 111 | 7.8 | ||
Liberal Democrats | Andrew Smith | 43 | 3.0 | ||
Liberal Democrats | Stuart Wild | 37 | 2.6 | ||
TUSC | Archie Harrison | 33 | 2.3 | ||
Turnout | 1,467 | 33.2 | |||
Registered electors | 4,419 | ||||
Labour hold | |||||
Labour hold | |||||
Party | Candidate | Votes | % | ±% | |
---|---|---|---|---|---|
Liberal Democrats | Mel Allcott* | 1,798 | 73.0 | ||
Liberal Democrats | Jessie Jagger* | 1,401 | 56.9 | ||
Liberal Democrats | Karen Lawrence* | 1,333 | 54.1 | ||
Conservative | Chris Thorp | 473 | 19.2 | ||
Conservative | Trish Nosal | 373 | 15.1 | ||
Conservative | Tom Wisniewski | 360 | 14.6 | ||
Labour | Joy Squires | 333 | 13.5 | ||
Labour | Louis Allaway | 309 | 12.5 | ||
Green | Mandy Neill | 289 | 11.7 | ||
Labour | Tom Henri | 267 | 12.5 | ||
Green | Claire Nichols | 236 | 11.7 | ||
Green | Simon Bovey | 221 | 9.6 | ||
Turnout | 2,635 | 40.5 | |||
Registered electors | 6,500 | ||||
Liberal Democrats hold | |||||
Party | Candidate | Votes | % | ±% | |
---|---|---|---|---|---|
Labour | Matt Lamb* | 609 | 57.6 | ||
Labour | Robyn Norfolk* | 478 | 45.2 | ||
Conservative | Margarete Cawte | 211 | 19.9 | ||
Conservative | Mike Wilson | 206 | 19.5 | ||
Green | Katherine Pingree | 153 | 14.5 | ||
Green | Nicola Silverster | 121 | 11.4 | ||
Liberal Democrats | Andrew Holmes | 71 | 6.7 | ||
UKIP | Martin Potter | 68 | 6.4 | ||
TUSC | Mark Davies | 38 | 3.6 | ||
Turnout | 1,058 | 23.32 | |||
Registered electors | 4,537 | ||||
Labour win (new seat) | |||||
Labour win (new seat) |
Party | Candidate | Votes | % | ±% | |
---|---|---|---|---|---|
Labour | Jaabba Riaz* | 655 | 53.7 | ||
Labour | Atif Sadiq* | 504 | 41.3 | ||
Green | Helen McCarthy | 274 | 22.4 | ||
Independent | Naheem Zafar | 252 | 20.6 | ||
Independent | Resnu Meah | 236 | 19.3 | ||
Green | Justin Kirby | 179 | 14.7 | ||
Conservative | Antonio Martins | 130 | 10.7 | ||
Conservative | Maria Martins | 128 | 10.5 | ||
Liberal Democrats | Andrew Lee | 83 | 6.8 | ||
Turnout | 1,275 | 35.4 | |||
Registered electors | 3,607 | ||||
Labour win (new seat) | |||||
Labour win (new seat) |
Party | Candidate | Votes | % | ±% | |
---|---|---|---|---|---|
Green | Andrew Cross* | 1,029 | 65.8 | ||
Green | Katie Collier* | 906 | 57.9 | ||
Conservative | Jithin Bittu | 364 | 23.3 | ||
Conservative | Tony Lippett | 346 | 22.1 | ||
Labour | Jamsheyd Ali | 199 | 12.7 | ||
Labour | Sunil Desayrah | 176 | 11.2 | ||
Liberal Democrats | Paul Jagger | 64 | 4.1 | ||
Liberal Democrats | Bart Ricketts | 46 | 2.9 | ||
Turnout | 35.6 | ||||
Green win (new seat) | |||||
Green win (new seat) |
Party | Candidate | Votes | % | ±% | |
---|---|---|---|---|---|
Conservative | Alan Amos* | 817 | 49.4 | ||
Labour | Sue Smith* | 752 | 45.5 | ||
Labour | Aaron Daniels | 653 | 39.5 | ||
Conservative | Lucy Hodgson | 569 | 34.4 | ||
Green | Stephen Brohan | 194 | 11.7 | ||
Green | Stephen Alaric | 170 | 10.3 | ||
Liberal Democrats | John Ondreasz | 129 | 7.8 | ||
TUSC | Eloise Davies | 23 | 1.4 | ||
Turnout | 1,813 | 39.89 | |||
Registered electors | 4,545 | ||||
Conservative win (new seat) | |||||
Labour win (new seat) |
Party | Candidate | Votes | % | ±% | |
---|---|---|---|---|---|
Labour | Pat Agar* | 994 | 51.1 | ||
Labour | Elaine Willmore* | 963 | 49.6 | ||
Labour | Bash Ali* | 807 | 41.5 | ||
Conservative | Allah Ditta | 472 | 24.3 | ||
Conservative | Leon Babu | 442 | 22.7 | ||
Conservative | Lucy Owen | 417 | 21.5 | ||
Green | Barbara Mitra | 340 | 17.5 | ||
Green | Alice Ponder | 302 | 15.5 | ||
Independent | Nadeem Ahmed | 260 | 13.4 | ||
Reform UK | David Carney | 203 | 10.4 | ||
Liberal Democrats | Scott Butler | 184 | 9.5 | ||
Green | Jacek Zmarzlik | 157 | 8.1 | ||
Independent | Asfand Ali | 146 | 7.5 | ||
Independent | Mikaeel Zafar | 143 | 7.4 | ||
Turnout | 31.6 | ||||
Labour hold | |||||
Labour hold | |||||
Labour hold | |||||
Party | Candidate | Votes | % | ±% | |
---|---|---|---|---|---|
Labour | Adrian Gregson* | 550 | 47.1 | ||
Labour | Zoe Cookson* | 525 | 45.0 | ||
Green | Nick Weeks | 488 | 41.8 | ||
Green | Josh Trimmer | 464 | 39.8 | ||
Conservative | Keith Burton | 161 | 13.8 | ||
Conservative | Mike Rouse | 96 | 8.2 | ||
Liberal Democrats | Susan Carpenter | 50 | 4.3 | ||
Turnout | 1,244 | 26.4 | |||
Registered electors | 4,709 | ||||
Labour hold | |||||
Labour hold | |||||
Party | Candidate | Votes | % | ±% | |
---|---|---|---|---|---|
Green | Tor Pingree* | 788 | 52.4 | ||
Green | Alex Kinnersley | 598 | 39.8 | ||
Conservative | Bertie Ballinger | 533 | 35.5 | ||
Conservative | Seb James | 482 | 32.1 | ||
Labour | Ian Craigan | 263 | 17.5 | ||
Labour | Jacqui Wilde | 179 | 11.9 | ||
Reform UK | Max Windsor-Peplow | 94 | 6.3 | ||
Liberal Democrats | Steve Mather | 59 | 4.6 | ||
Turnout | 37.2 | ||||
Green hold | |||||
Green gain from Conservative |
Party | Candidate | Votes | % | ±% | |
---|---|---|---|---|---|
Labour | Richard Udall* | 864 | 68.7 | ||
Labour | Jenny Barnes | 630 | 50.1 | ||
Green | Rob Ottolangui | 355 | 28.2 | ||
Green | Annie Swift | 322 | 25.6 | ||
Conservative | Susan Burge | 164 | 13.0 | ||
Conservative | Alexander Snell | 124 | 9.9 | ||
Liberal Democrats | Peter Jackson | 55 | 4.4 | ||
Turnout | 1,401 | 32.8 | |||
Registered electors | 4,277 | ||||
Labour hold | |||||
Labour hold | |||||
Party | Candidate | Votes | % | ±% | |
---|---|---|---|---|---|
Liberal Democrats | Sarah Murray* | 796 | 52.0 | ||
Liberal Democrats | John Rudge | 569 | 37.2 | ||
Conservative | Stephen Hodgson* | 415 | 27.1 | ||
Green | Martyn Hencher | 385 | 25.1 | ||
Conservative | Janet Lippett | 298 | 19.5 | ||
Green | Clare Wratten | 295 | 19.3 | ||
Labour | Mike Stafford | 172 | 11.2 | ||
Labour | Chris Taylor | 132 | 8.6 | ||
Turnout | 1,595 | 39.3 | |||
Registered electors | 4,059 | ||||
Liberal Democrats win (new seat) | |||||
Liberal Democrats win (new seat) |
Party | Candidate | Votes | % | ±% | |
---|---|---|---|---|---|
Green | Steve Cockeram* | 832 | 47.7 | ||
Green | Elena Round* | 724 | 41.5 | ||
Liberal Democrats | John Renshaw | 537 | 30.8 | ||
Conservative | James Woolgar | 428 | 24.5 | ||
Conservative | Steve Mackay | 428 | 24.5 | ||
Liberal Democrats | Ken Carpenter | 216 | 12.4 | ||
Labour | Jenny Benfield | 181 | 10.4 | ||
Labour | Stephen Tallett | 142 | 8.1 | ||
Turnout | 36.2 | ||||
Green hold | |||||
Green hold | |||||
Party | Candidate | Votes | % | ±% | |
---|---|---|---|---|---|
Green | Alex Mace | 995 | 69.8 | ||
Green | Neil Laurenson* | 981 | 68.9 | ||
Conservative | Jason Wild | 256 | 18.0 | ||
Labour | Ruth Coates | 224 | 15.7 | ||
Conservative | Angelika Wisniewska | 202 | 14.2 | ||
Labour | Mark Willmore | 138 | 9.7 | ||
Liberal Democrats | Andrew Melville | 53 | 3.7 | ||
Turnout | 1,549 | 38.1 | |||
Registered electors | 4,065 | ||||
Green hold | |||||
Green hold | |||||
Party | Candidate | Votes | % | ±% | |
---|---|---|---|---|---|
Labour | Jill Desayrah* | 868 | 58.1 | ||
Labour | Ed Kimberley | 788 | 52.7 | ||
Labour | Naz Hussain | 708 | 47.4 | ||
Conservative | James Stanley* | 389 | 26.0 | ||
Conservative | Owen Cleary* | 388 | 26.0 | ||
Conservative | Shazad Ditta | 325 | 21.7 | ||
Green | Sue Braithwaite | 288 | 19.3 | ||
Green | Sarah Dukes | 235 | 15.7 | ||
Green | Phil Gilfillan | 165 | 11.0 | ||
Independent | Mohammed Awais | 140 | 9.4 | ||
Liberal Democrats | Simon Cottingham | 111 | 7.4 | ||
TUSC | Jason Ford | 80 | 5.4 | ||
Turnout | 22.8 | ||||
Labour win (new seat) | |||||
Labour win (new seat) |
Leicester City Council is a unitary authority responsible for local government in the city of Leicester, England. It consists of 54 councillors, representing 22 wards in the city, overseen by a directly elected mayor. It is currently controlled by the Labour Party and has been led by mayor Sir Peter Soulsby since 2011. The council also appoints a ceremonial Lord Mayor who chairs council meetings; the directly elected mayor is termed the City Mayor to distinguish the post from the Lord Mayor.
Birmingham City Council elections are held every four years. Birmingham City Council is the local authority for the metropolitan district of Birmingham in the West Midlands, England. Since the last boundary changes in 2018, 101 councillors have been elected from 69 wards. Prior to 2018 elections were held three years out of every four, with a third of the council elected each time.
Bromsgrove District Council elections are held every four years. Bromsgrove District Council is the local authority for the non-metropolitan district of Bromsgrove in Worcestershire, England. Since the last boundary changes in 2015, 31 councillors are elected from 30 wards.
Fenland District Council in Cambridgeshire, England is elected every four years. Since the last boundary changes in 2023, the council has comprised 43 councillors representing 18 wards, with each ward electing one, two or three councillors.
Sefton Metropolitan Borough Council elections are generally held three years out of every four, with a third of the council being elected each time. Sefton Metropolitan Borough Council, generally known as Sefton Council, is the local authority for the metropolitan borough of Sefton in Merseyside, England. Since the last boundary changes in 2004, 66 councillors have been elected from 22 wards.
Hertfordshire County Council in England is elected every four years. Since the last boundary changes took effect in 2017 there have been 78 electoral divisions electing one councillor each.
The 2006 Camden Council election took place on 4 May 2006 to elect members of Camden London Borough Council in London, England. The whole council was up for election and the Labour Party lost overall control of the council to no overall control.
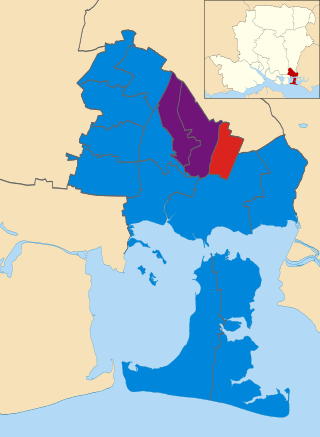
Medway Council is the local authority for the unitary authority of Medway in Kent, England. It was created on 1 April 1998 replacing Gillingham and Rochester-upon-Medway.
Thanet District Council elections are held every four years to elect Thanet District Council in Kent, England. Since the last boundary changes in 2003 the council has comprised 56 councillors representing 23 wards.
Worcester City Council is the local authority for Worcester, a non-metropolitan district with city status in Worcestershire, England. The council consists of 35 councillors, elected from 15 wards.
The 2015 Redcar and Cleveland Borough Council election took place on 7 May 2015 to elect members of Redcar and Cleveland Borough Council in England. This was on the same day as other local elections, as well as the 2015 General Election. One major change was that Council Leader George Dunning and many other Labour councillors resigned from the party or were deselected and ran as independent candidates. The election saw the council return to no overall control.
The 2015 Wychavon District Council election took place on 7 May 2015 to elect members of Wychavon District Council in Worcestershire, England. The whole council was up for election and the Conservative Party stayed in overall control of the council.
The 2015 Rother District Council election took place on 7 May 2015 to elect members of Rother District Council in East Sussex, England. The whole council was up for election and the Conservative Party stayed in overall control of the council.
The 2016 Havant Borough Council election took place on 5 May 2016 to elect members of Havant Borough Council in England. This was on the same day as other local elections.
The 2018 Lambeth London Borough Council election took place on 3 May 2018 alongside other local elections in London, to elect members of Lambeth London Borough Council in England. The election saw Labour remain in control of Lambeth Council with a slightly reduced majority, winning over 90% of the seats. The Green Party achieved its best-ever result in the borough, winning five seats and becoming the official opposition and the largest Green group in London.
The 2022 Birmingham City Council election took place on 5 May 2022, with all 101 council seats up for election across 37 single-member and 32 two-member wards. The election was held alongside other local elections across Great Britain and town council elections in Sutton Coldfield.
The 2006 Reading Borough Council election was held on 4 May 2006, at the same time as other local elections across England. Seventeen of the 46 seats on Reading Borough Council were up for election, being the usual third of the council plus two by-elections. The by-election in Southcote ward was caused by the resignation of Labour councillor Christopher Swaine, and the by-election in Thames was caused by the resignation of Conservative councillor Rob Wilson, who had been elected as the member of parliament for Reading East the previous year. Labour lost three seats at the election: two to the Conservatives and one to the Liberal Democrats. The Conservatives took the largest number of votes across the borough for the first time since 1992. Despite these losses, Labour remained in control of the council, with David Sutton continuing as leader of the party and the council.
The 2023 Worcester City Council election took place on 4 May 2023 to elect members of Worcester City Council in Worcestershire, England. This was on the same day as other local elections in England.
The 2024 Milton Keynes City Council elections were held on Thursday 2 May 2024, alongside the other local elections in the United Kingdom that were held on the same day. One-third of the 57 members of Milton Keynes City Council in Buckinghamshire were up for election.
The 2024 Sheffield City Council election took place on Thursday 2 May 2024, alongside the other local elections in the United Kingdom being held on the same day. One-third of the 84 members of Sheffield City Council in South Yorkshire was elected, alongside a vacancy in Firth Park ward.