| |||||||||||||||||||||||||||||||||||||||||||||
37 police and crime commissioners in England and Wales | |||||||||||||||||||||||||||||||||||||||||||||
---|---|---|---|---|---|---|---|---|---|---|---|---|---|---|---|---|---|---|---|---|---|---|---|---|---|---|---|---|---|---|---|---|---|---|---|---|---|---|---|---|---|---|---|---|---|
| |||||||||||||||||||||||||||||||||||||||||||||
Colours denote the winning party, as shown in the main table of results. |
Elections for police and crime commissioners in England and Wales took place on 2 May 2024, the same day as local elections in England. [1]
Police and crime commissioners (PCCs) are elected representatives with responsibility for policing in each police area in England and Wales. Each police area elects a commissioner every four years, with the exception of police areas where responsibility for policing has passed to regional mayors such as Greater London and Greater Manchester.
This was the first Police and Crime Commissioner elections to use the first past the post system following the passage of the Elections Act 2022. [2] The supplementary vote system had been used for previous elections. [3]
The Policing and Crime Act 2017, which amended the 2011 Act, enabled PCCs to take over governance of the local fire and rescue service. PCCs who have taken on these responsibilities are known as Police Fire and Crime Commissioners (PFCCs). [4]
In 2023, it was reported that Rishi Sunak's government wants to create more elected metro mayors to take over the role of PCCs. [5] The roles of PCCs for North Yorkshire, and South Yorkshire will be abolished, with responsibilities being taken over by their respective metro mayors. [6] [7] The government had planned to abolish the West Midlands PCC and transfer its powers to the Mayor of the West Midlands, however the incumbent PCC, Simon Foster, successfully challenged the transfer of powers in the High Court. [8]
Party | Votes | % votes | Change | Stood | Seats | % seats | Change | |
---|---|---|---|---|---|---|---|---|
Labour | 2,887,150 | 37.2 | +7.5 | 37 | 17 | 45.95 | +9 | |
Conservative | 2,727,820 | 35.2 | -9.3 | 37 | 19 | 51.35 | -11 | |
Liberal Democrats | 1,299,743 | 16.8 | +3.5 | 35 | 0 | — | ±0 | |
Green | 257,558 | 3.3 | +0.9 | 8 | 0 | — | ±0 | |
Independent | 256,314 | 3.3 | -1.6 | 6 | 0 | — | ±0 | |
Plaid Cymru | 92,063 | 1.2 | -0.9 | 4 | 1 | 2.70 | ±0 | |
Reform UK | 66,464 | 0.9 | -0.2 | 2 | 0 | — | ±0 | |
English Democrat | 63,537 | 0.8 | +0.4 | 3 | 0 | — | ±0 | |
More Police Officers for Thames Valley | 46,853 | 0.6 | N/A | 1 | 0 | — | ±0 | |
Justice and Anti-Corruption | 40,691 | 0.5 | N/A | 1 | 0 | — | ±0 | |
Workers Party | 8,396 | 0.1 | N/A | 1 | 0 | — | ±0 | |
One Leicester | 7,104 | 0.1 | N/A | 1 | 0 | — | ±0 | |
Party | Candidate | Votes | % | ±% | |
---|---|---|---|---|---|
Labour Co-op | Clare Moody | 95,982 | 32.3 | +8.6 | |
Conservative | Mark Shelford | 91,006 | 30.6 | -4.1 | |
Green | Katy Grant | 64,623 | 21.7 | +5.3 | |
Liberal Democrats | Benet Allen | 45,864 | 15.4 | +2.0 | |
Turnout | 300,744 | 23.1 | -7.6 | ||
Rejected ballots | 3,262 | 1.1 | |||
Labour Co-op gain from Conservative | Swing | ||||
Party | Candidate | Votes | % | ±% | |
---|---|---|---|---|---|
Labour Co-op | John Tizard | 40,738 | 40.5 | +5.5 | |
Conservative | Festus Akinbusoye | 35,688 | 35.5 | -6.9 | |
Liberal Democrats | Jasbir Singh Parmar | 15,857 | 15.8 | -2.7 | |
Workers Party | Waheed Akbar | 8,396 | 8.3 | N/A | |
Majority | 5,050 | ||||
Turnout | 101,600 | 19.8 | |||
Rejected ballots | 921 | 0.9 | |||
Labour Co-op gain from Conservative | Swing | ||||
District | Total votes | Conservative | Labour Co-op | Lib Dem | Workers Party of Britain | ||||
---|---|---|---|---|---|---|---|---|---|
# | % | # | % | # | % | # | % | ||
Bedford | 28,289 | 10,758 | 38.0 | 10,930 | 38.6 | 5,194 | 18.4 | 1,407 | 5.0 |
Central Bedfordshire | 44,996 | 18,541 | 41.2 | 17,979 | 40.0 | 7,206 | 16.0 | 1,270 | 2.8 |
Luton | 27,394 | 6,389 | 23.3 | 11,829 | 43.2 | 3,457 | 12.6 | 5,719 | 20.9 |
Party | Candidate | Votes | % | ±% | |
---|---|---|---|---|---|
Conservative | Darryl Preston | 61,688 | 38.1 | -4.8 | |
Labour Co-op | Anna Smith | 58,304 | 36.0 | +4.7 | |
Liberal Democrats | Edna Murphy | 41,984 | 25.9 | +3.6 | |
Turnout | 161,976 | 25.6 | |||
Rejected ballots | 2,837 | 1.7 | |||
Conservative hold | Swing | ||||
Party | Candidate | Votes | % | ±% | |
---|---|---|---|---|---|
Labour | Dan Price | 86,279 | 48.1 | +10.8 | |
Conservative | John Dwyer | 65,836 | 36.7 | -7.9 | |
Liberal Democrats | Paul Duffy | 27,342 | 15.2 | +0.7 | |
Turnout | 179,457 | 21.7 | |||
Rejected ballots | 2,518 | 1.4 | |||
Labour gain from Conservative | Swing | ||||
Party | Candidate | Votes | % | ±% | |
---|---|---|---|---|---|
Labour Co-op | Matt Storey | 65,418 | 52.6 | +23.7 | |
Conservative | Steve Turner | 58,977 | 47.4 | -6.8 | |
Turnout | 124,395 | 30.2 | |||
Labour Co-op gain from Conservative | Swing | ||||
Party | Candidate | Votes | % | ±% | |
---|---|---|---|---|---|
Labour Co-op | David Allen | 38,708 | 47.4 | +21.3 | |
Conservative | Mike Johnson | 24,863 | 30.4 | -23.1 | |
Liberal Democrats | Adrian Waite | 18,100 | 22.2 | +1.8 | |
Turnout | 81,671 | 21.2 | |||
Labour Co-op gain from Conservative | Swing | ||||
Party | Candidate | Votes | % | ±% | |
---|---|---|---|---|---|
Labour Co-op | Nicolle Ndiweni | 93,260 | 43.6 | +6.1 | |
Conservative | Angelique Foster | 65,293 | 30.5 | -18.9 | |
Reform UK | Russell Armstrong | 32,944 | 15.4 | +11.6 | |
Liberal Democrats | David Hancock | 22,540 | 10.5 | +1.3 | |
Turnout | 216,851 | 26.9 | |||
Rejected ballots | 2,814 | 1.3 | |||
Labour Co-op gain from Conservative | Swing | ||||
Party | Candidate | Votes | % | ±% | |
---|---|---|---|---|---|
Conservative | Alison Hernandez | 131,764 | 43.3 | -6.7 | |
Labour Co-op | Daniel Steel | 107,897 | 35.4 | +15.2 | |
Liberal Democrats | Steve Lodge | 64,790 | 21.3 | +3.4 | |
Turnout | 304,451 | 22.5 | -13.6 | ||
Conservative hold | Swing | -21.9 | |||
Party | Candidate | Votes | % | ±% | |
---|---|---|---|---|---|
Conservative | David Sidwick | 57,994 | 38.2 | -4.3 | |
Liberal Democrats | Howard Legg | 34,774 | 22.9 | +11.1 | |
Independent | Marianne Storey | 32,237 | 21.2 | N/A | |
Labour Co-op | David Stokes | 26,884 | 17.7 | +6.8 | |
Turnout | 154,436 | 26.0 | |||
Rejected ballots | 2,550 | 1.7 | |||
Conservative hold | Swing | ||||
Party | Candidate | Votes | % | ±% | |
---|---|---|---|---|---|
Labour Co-op | Joy Allen | 66,752 | 56.0 | +12.2 | |
Conservative | Rob Potts | 37,773 | 31.7 | -11.3 | |
Liberal Democrats | Nigel Boddy | 14,678 | 12.3 | -0.9 | |
Turnout | 119,303 | ||||
Labour Co-op hold | Swing | ||||
Party | Candidate | Votes | % | ±% | |
---|---|---|---|---|---|
Conservative | Roger Hirst | 126,447 | 37.1 | -16.9 | |
Labour Co-op | Adam Fox | 116,875 | 34.3 | +11.4 | |
Liberal Democrats | Kieron Franks | 52,922 | 15.5 | +2.2 | |
English Democrat | Robin Tilbrook | 44,909 | 13.2 | +3.4 | |
Turnout | 330,397 | 24.9 | |||
Rejected ballots | 5,200 | 1.5 | |||
Conservative hold | Swing | ||||
District | Total votes | Conservative | Labour Co-op | Lib Dem | English Democrats | ||||
---|---|---|---|---|---|---|---|---|---|
# | % | # | % | # | % | # | % | ||
Basildon | 34,174 | 13,181 | 38.6 | 12,096 | 35.4 | 3,860 | 11.3 | 5,042 | 14.8 |
Braintree | 21,631 | 8,849 | 40.9 | 7,878 | 36.4 | 2,107 | 9.7 | 2,797 | 12.9 |
Brentwood | 19,495 | 7,903 | 40.5 | 3,956 | 20.3 | 5,896 | 30.2 | 1,740 | 8.9 |
Castle Point | 19,271 | 7,690 | 39.9 | 4,997 | 25.9 | 1,671 | 8.7 | 4,913 | 25.5 |
Chelmsford | 25,313 | 9,976 | 39.4 | 5,965 | 23.6 | 6,805 | 26.9 | 2,567 | 10.1 |
Colchester | 41,107 | 12,079 | 29.4 | 16,040 | 39.0 | 9,389 | 22.8 | 3,599 | 8.8 |
Epping Forest | 28,972 | 12,725 | 43.9 | 7,584 | 26.2 | 4,856 | 16.8 | 3,807 | 13.1 |
Harlow | 18,224 | 7,189 | 39.4 | 8,338 | 45.8 | 1,111 | 6.1 | 1,586 | 8.7 |
Maldon | 9,066 | 3,989 | 44.0 | 2,341 | 25.8 | 1,166 | 12.9 | 1,570 | 17.3 |
Rochford | 18,779 | 7,022 | 37.4 | 4,845 | 25.8 | 3,627 | 19.3 | 3,285 | 17.5 |
Southend-on-Sea | 39,145 | 13,783 | 35.2 | 15,925 | 40.7 | 5,337 | 13.6 | 4,100 | 10.5 |
Tendring | 20,953 | 8,441 | 40.3 | 6,795 | 32.4 | 2,162 | 10.3 | 3,555 | 17.0 |
Thurrock | 30,952 | 7,891 | 25.5 | 15,806 | 51.1 | 2,616 | 8.5 | 4,639 | 15.0 |
Uttlesford | 14,066 | 5,729 | 40.7 | 4,309 | 30.6 | 2,319 | 16.5 | 1,709 | 12.1 |
Party | Candidate | Votes | % | ±% | |
---|---|---|---|---|---|
Conservative | Chris Nelson | 47,838 | 32.7 | -8.0 | |
Liberal Democrats | Martin Surl | 46,352 | 31.7 | +12.7 | |
Labour Co-op | Ashley Smith | 35,069 | 24.0 | +7.9 | |
Independent | Matthew Randolph | 15,240 | 10.4 | N/A | |
Majority | 1,486 | 1.0 | |||
Rejected ballots | 1,851 | 1.3 | |||
Turnout | 146,347 | 29.5 | |||
Conservative hold | Swing | ||||
Party | Candidate | Votes | % | ±% | |
---|---|---|---|---|---|
Conservative | Donna Jones | 175,953 | 42.3 | -7.5 | |
Labour Co-op | Becky Williams | 106,141 | 25.5 | +6.2 | |
Liberal Democrats | Prad Bains | 92,843 | 22.3 | +4.6 | |
Justice & Anti-Corruption | Don Jerrard | 40,691 | 9.8 | N/A | |
Turnout | 421,965 | 28.4 | |||
Rejected ballots | 6,337 | 1.5 | |||
Conservative hold | Swing | ||||
Party | Candidate | Votes | % | ±% | |
---|---|---|---|---|---|
Conservative | Jonathan Ash-Edwards | 93,658 | 36.7 | -11.8 | |
Liberal Democrats | Sean Prendergast | 68,264 | 26.7 | -0.6 | |
Labour Co-op | Tom Plater | 66,585 | 26.1 | +2.1 | |
Green | Matt Fisher | 26,714 | 10.5 | N/A | |
Turnout | 258,298 | ||||
Rejected ballots | 3,077 | 1.2 | |||
Conservative hold | Swing | ||||
Party | Candidate | Votes | % | ±% | |
---|---|---|---|---|---|
Conservative | Jonathan Evison | 51,083 | 39.7 | -5.9 | |
Labour Co-op | Simon O'Rourke | 46,846 | 36.4 | -3.0 | |
Liberal Democrats | Bob Morgan | 30,834 | 24.0 | +8.9 | |
Turnout | 128,769 | 18.7 | |||
Conservative hold | Swing | ||||
Party | Candidate | Votes | % | ±% | |
---|---|---|---|---|---|
Conservative | Matthew Scott | 120,491 | 44.1 | -13.7 | |
Labour Co-op | Lenny Rolles | 92,508 | 33.9 | +8.6 | |
Liberal Democrats | Graham Colley | 60,279 | 22.1 | +5.1 | |
Turnout | 273,278 | ||||
Total votes | |||||
Conservative hold | Swing | ||||
Party | Candidate | Votes | % | ±% | |
---|---|---|---|---|---|
Labour Co-op | Clive Grunshaw | 135,638 | 47.1 | +5.6 | |
Conservative | Andrew Snowden | 101,281 | 35.1 | -9.6 | |
Liberal Democrats | Neil Darby | 51,252 | 17.8 | +9.0 | |
Turnout | 297,705 | 26.2 | |||
Rejected ballots | 9,534 | 3.2 | |||
Labour Co-op gain from Conservative | Swing | ||||
Party | Candidate | Votes | % | ±% | |
---|---|---|---|---|---|
Conservative | Rupert Matthews | 62,280 | 35.3 | -14.0 | |
Labour Co-op | Rory Palmer | 61,420 | 34.8 | +1.5 | |
Green | Aasiya Bora | 23,649 | 13.4 | N/A | |
Liberal Democrats | Ian Sharpe | 22,041 | 12.5 | -5.0 | |
One Leicester | Fizza Askari | 7,104 | 4.0 | N/A | |
Turnout | 176,494 | 21.7 | |||
Conservative hold | Swing | ||||
Party | Candidate | Votes | % | ±% | |
---|---|---|---|---|---|
Conservative | Marc Jones | 39,639 | 36.5 | -23.2 | |
Labour Co-op | Mike Horder | 31,931 | 29.5 | +9.5 | |
Reform UK | Peter Escreet | 15,518 | 14.3 | +10.8 | |
Liberal Democrats | Lesley Rollings | 13,380 | 12.4 | +6.4 | |
English Democrat | David Dickason | 7,739 | 7.2 | N/A | |
Turnout | 108,207 | 19.09 | |||
Conservative hold | Swing | ||||
Party | Candidate | Votes | % | ±% | |
---|---|---|---|---|---|
Labour Co-op | Emily Spurrell | 152,640 | 61.7 | +4.9 | |
Conservative | Bob Teesdale | 35,221 | 14.2 | -8.6 | |
Green | Amanda Onwuemene | 31,330 | 12.7 | N/A | |
Liberal Democrats | Christopher Carubia | 28,093 | 11.4 | -5.2 | |
Turnout | 251,600 | 23.9 | -7.0 | ||
Rejected ballots | 4,316 | 1.7 | -1.8 | ||
Labour Co-op hold | Swing | 6.7 | |||
Party | Candidate | Votes | % | ±% | |
---|---|---|---|---|---|
Labour Co-op | Sarah Taylor | 52,445 | 35.2 | +13.1 | |
Conservative | Giles Orpen-Smellie | 50,567 | 33.9 | -11.2 | |
Green | Martin Schmierer | 23,628 | 15.8 | +5.6 | |
Liberal Democrats | John Crofts | 22,525 | 15.1 | +1.4 | |
Turnout | 149,165 | ||||
Labour Co-op gain from Conservative | Swing | ||||
Party | Candidate | Votes | % | ±% | |
---|---|---|---|---|---|
Labour Co-op | Danielle Stone | 43,684 | 39.3 | +11.8 | |
Conservative | Martyn Emberson | 39,714 | 35.7 | -17.5 | |
Liberal Democrats | Ana Savage Gunn | 27,799 | 25.0 | +9.7 | |
Turnout | 111,197 | 19.6 | -15.2 | ||
Labour Co-op gain from Conservative | Swing | 14.6 | |||
Party | Candidate | Votes | % | ±% | |
---|---|---|---|---|---|
Labour Co-op | Susan Dungworth | 176,311 | 51.0 | +4.4 | |
Conservative | Ros Munro | 78,818 | 22.8 | -8.0 | |
Liberal Democrats | John Appleby | 58,574 | 17.0 | +6.4 | |
Independent | Mustaque Rahman | 31,773 | 9.2 | N/A | |
Turnout | 345,476 | 33.0 | -4.0 | ||
Labour Co-op hold | Swing | ||||
Party | Candidate | Votes | % | ±% | |
---|---|---|---|---|---|
Labour Co-op | Gary Godden | 119,355 | 52.1 | +8.6 | |
Conservative | Caroline Henry | 77,148 | 33.7 | -14.2 | |
Liberal Democrats | David Watts | 32,410 | 14.2 | +5.5 | |
Turnout | 234,266 | 28.1 | |||
Labour Co-op gain from Conservative | Swing | ||||
Party | Candidate | Votes | % | ±% | |
---|---|---|---|---|---|
Conservative | Ben Adams | 73,500 | 45.6 | -10.1 | |
Labour Co-op | Alastair Watson | 70,128 | 43.5 | +16.0 | |
Liberal Democrats | Alec Sandiford | 17,666 | 11.0 | +6.6 | |
Turnout | 161,294 | 19.2 | |||
Conservative hold | Swing | ||||
Party | Candidate | Votes | % | ±% | |
---|---|---|---|---|---|
Conservative | Tim Passmore | 52,968 | 40.2 | -14.5 | |
Labour Co-op | Robin Wales | 41,734 | 31.7 | +8.7 | |
Green | Rachel Smith-Lyte | 22,488 | 17.1 | +3.5 | |
Liberal Democrats | James Sandbach | 14,541 | 11.0 | -2.8 | |
Turnout | 131,731 | ||||
Conservative hold | Swing | ||||
Party | Candidate | Votes | % | ±% | |
---|---|---|---|---|---|
Conservative | Lisa Townsend | 95,538 | 36.4 | +2.9 | |
Liberal Democrats | Paul Kennedy | 82,213 | 31.3 | +10.6 | |
Labour | Kate Chinn | 42,813 | 16.3 | +0.4 | |
Independent | Alex Coley | 42,052 | 16.0 | N/A | |
Turnout | 265,682 | 29.9 | -8.9 | ||
Rejected ballots | 3,066 | 1.2 | |||
Conservative hold | Swing | ||||
Party | Candidate | Votes | % | ±% | |
---|---|---|---|---|---|
Conservative | Katy Bourne | 122,495 | 39.0 | -8.2 | |
Labour Co-op | Paul Richards | 99,502 | 31.7 | +13.1 | |
Liberal Democrats | Jamie Bennett | 48,923 | 15.6 | +1.7 | |
Green | Jonathan Kent | 43,105 | 13.7 | +0.4 | |
Turnout | 317,718 | 24.5 | -11.2 | ||
Rejected ballots | 3,693 | 1.2 | |||
Conservative hold | Swing | ||||
Party | Candidate | Votes | % | ±% | |
---|---|---|---|---|---|
Conservative | Matthew Barber | 144,092 | 32.1 | -10.4 | |
Labour Co-op | Tim Starkey | 141,749 | 31.6 | +3.8 | |
Liberal Democrats | Tim Bearder | 84,341 | 18.8 | +1.3 | |
More Police Officers for Thames Valley | Ben Holden-Crowther | 46,853 | 10.4 | N/A | |
Independent | Russell Douglas Fowler | 31,460 | 7.0 | N/A | |
Turnout | 448,495 | ||||
Conservative hold | Swing | -7.1 | |||
Party | Candidate | Votes | % | ±% | |
---|---|---|---|---|---|
Conservative | Philip Seccombe | 45,638 | 39.4 | -12.7 | |
Labour Co-op | Sarah Feeney | 45,377 | 39.2 | +11.5 | |
Liberal Democrats | Richard Dickson | 24,867 | 21.5 | +5.3 | |
Turnout | 117,518 | 26.0 | |||
Rejected ballots | 1,636 | 1.4 | |||
Conservative hold | Swing | ||||
Party | Candidate | Votes | % | ±% | |
---|---|---|---|---|---|
Conservative | John-Paul Campion | 73,395 | 34.3 | -21.0 | |
Labour Co-op | Richard Overton | 63,082 | 29.5 | +5.5 | |
Liberal Democrats | Sarah Murray | 33,782 | 15.8 | +0.2 | |
Green | Julian Dean | 22,021 | 10.3 | N/A | |
English Democrat | Henry Curteis | 21,645 | 10.1 | N/A | |
Turnout | 213,925 | ||||
Conservative hold | Swing | ||||
Party | Candidate | Votes | % | ±% | |
---|---|---|---|---|---|
Labour | Simon Foster | 327,844 | 57.5 | +12.0 | |
Conservative | Tom Byrne | 241,827 | 42.5 | +3.1 | |
Turnout | 595,218 | 29.5 | |||
Rejected ballots | 23,663 | 4.0 | |||
Labour hold | Swing | ||||
Party | Candidate | Votes | % | ±% | ||||
---|---|---|---|---|---|---|---|---|
Conservative | Philip Wilkinson | 38,578 | 31.0 | -5.0 | ||||
Labour Co-op | Stanka Adamcova | 36,345 | 29.2 | +14.9 | ||||
Independent | Mike Rees | 29,035 | 23.3 | -4.5 | ||||
Liberal Democrats | Alan Hagger | 20,485 | 16.5 | -3.3 | ||||
Turnout | 125,927 | 22.7 | +6.1 | |||||
Conservative hold |
Party | Candidate | Votes | % | ±% | |
---|---|---|---|---|---|
Plaid Cymru | Dafydd Llywelyn | 31,323 | 40.9 | +7.3 | |
Conservative | Ian Harrison | 19,134 | 25.0 | -9.0 | |
Labour Co-op | Philippa Thompson | 18,353 | 24.0 | +0.3 | |
Liberal Democrats | Justin Griffiths | 7,719 | 10.1 | +1.4 | |
Turnout | 76,529 | ||||
Plaid Cymru hold | Swing | ||||
Party | Candidate | Votes | % | ±% | |
---|---|---|---|---|---|
Labour Co-op | Jane Mudd | 28,476 | 41.7 | -0.1 | |
Conservative | Hannah Jarvis | 21,919 | 32.1 | +3.2 | |
Plaid Cymru | Donna Cushing | 9,864 | 14.4 | -1.8 | |
Liberal Democrats | Mike Hamilton | 8,078 | 11.8 | +7.6 | |
Turnout | 68,337 | ||||
Labour Co-op hold | Swing | ||||
Party | Candidate | Votes | % | ±% | |
---|---|---|---|---|---|
Labour Co-op | Andy Dunbobbin | 31,950 | 36.0 | +6.9 | |
Conservative | Brian Jones | 26,281 | 29.6 | -2.0 | |
Plaid Cymru | Ann Griffith | 23,466 | 26.4 | -2.0 | |
Liberal Democrats | Richard Marbrow | 7,129 | 8.0 | +3.7 | |
Turnout | 88,826 | ||||
Labour Co-op hold | Swing | ||||
Party | Candidate | Votes | % | ±% | |
---|---|---|---|---|---|
Labour Co-op | Emma Wools | 73,128 | 45.2 | +4.2 | |
Conservative | George Carroll | 43,344 | 26.8 | +2.5 | |
Plaid Cymru | Dennis Clarke | 27,410 | 16.9 | -2.1 | |
Liberal Democrats | Sam Bennett | 17,908 | 11.1 | +6.5 | |
Turnout | 161,790 | ||||
Labour Co-op hold | Swing | ||||
Basingstoke is a constituency in Hampshire represented in the House of Commons of the UK Parliament since 2005 by Maria Miller, a member of the Conservative Party who served as Culture Secretary and Minister for Women and Equalities from 2012 to 2014 under Prime Minister David Cameron.
Croydon Central is a constituency created in 1974 and is represented in the House of Commons of the UK Parliament since 2017 by Labour MP Sarah Jones. The seat bucked the trend in national results in 2019, with Labour holding the seat with a slightly increased majority.
Hitchin and Harpenden is a constituency represented in the House of Commons of the UK Parliament since 2017 by Bim Afolami, a Conservative.
Croydon North is a constituency represented in the House of Commons of the UK Parliament since 2012 by Steve Reed of Labour Co-op. The seat was created in 1918 and split in two in 1955 and re-devised in a wholly different form in 1997.
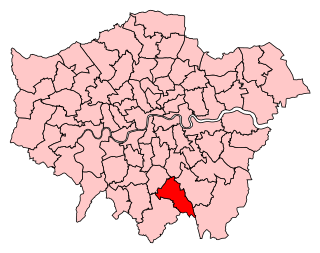
Croydon South is a constituency created in 1974 and represented in the House of Commons of the UK Parliament since 2015 by Chris Philp, a Conservative.
Christopher Ian Brian Mynott Philp is a British politician serving as Minister of State for Crime, Policing and Fire since October 2022. He previously served in Liz Truss's cabinet from September to October 2022 as Chief Secretary to the Treasury and then as Minister for the Cabinet Office and Paymaster General. A member of the Conservative Party, he has been the Member of Parliament (MP) for Croydon South since 2015.
The 2012 police and crime commissioner elections were polls held in most police areas in England and Wales on Thursday 15 November. The direct election of police and crime commissioners (PCCs) was originally scheduled for May 2012 but was postponed in order to secure the passage of the Police Reform and Social Responsibility Act 2011 through the House of Lords. The government considers the elected commissioners to have a stronger mandate than the "unelected and invisible police authorities that they replace". The elections took place alongside by-elections for the House of Commons in Cardiff South and Penarth, Corby and Manchester Central, and a mayoral election in Bristol.
A police and crime commissioner is an elected official in England and Wales responsible for generally overseeing police forces. A police, fire and crime commissioner (PFCC) is an elected official in England responsible for generally overseeing both police forces and fire services. Commissioners replaced now-abolished police authorities. The first incumbents were elected on 15 November 2012.
The Devon and Cornwall Police and Crime Commissioner is the police and crime commissioner, an elected official tasked with setting out the way crime is tackled by Devon and Cornwall Police in the English counties of Devon and Cornwall. The post was created in November 2012, following an election held on 15 November 2012, and replaced the Devon and Cornwall Police Authority. The current incumbent is Alison Hernandez, who represents the Conservative Party.
The Avon and Somerset Police and Crime Commissioner is the police and crime commissioner, an elected official tasked with setting out the way crime is tackled by Avon and Somerset Police in the English unitary authorities of Bristol, Bath and North East Somerset, North Somerset, South Gloucestershire and Somerset. The post was created in November 2012, following an election held on 15 November 2012, and replaced the Avon and Somerset Police Authority. Clare Moody was elected to the role in the May 2024 election.
The Bedfordshire Police and Crime Commissioner is the police and crime commissioner, an elected official tasked with setting out the way crime is tackled by Bedfordshire Police in the English County of Bedfordshire. The post was created in November 2012, following an election held on 15 November 2012, and replaced the Bedfordshire Police Authority. The current incumbent is John Tizard, who represents the Labour Party. The current chief executive of the OPCC is Clare Kelly.
The West Midlands Police and Crime Commissioner is the police and crime commissioner of the West Midlands Police.
The 2014 West Midlands Police and Crime Commissioner by-election was a by-election for the position of Police and Crime Commissioner in the West Midlands Police region of the United Kingdom, held on 21 August 2014. It was triggered by the death of Bob Jones, the inaugural West Midlands Police and Crime Commissioner, who died on 1 July 2014.
The South Yorkshire Police and Crime Commissioner by-election was a 2014 by-election on 30 October 2014 for the position of Police and Crime Commissioner in the South Yorkshire Police region of the United Kingdom. It was triggered by the resignation of Shaun Wright, the inaugural South Yorkshire Police and Crime Commissioner, who stepped down from the position on 16 September 2014 following the Rotherham child sexual exploitation scandal. Wright had been head of children's services in Rotherham between 2005 and 2010, while events surrounding the scandal were taking place. The Labour candidate, Alan Billings, was elected.
Elections of police and crime commissioners in England and Wales were held on 5 May 2016.
The Essex Police, Fire and Crime Commissioner is the police and crime commissioner, an elected official tasked with setting out the way crime is tackled by Essex Police in the English County of Essex. The post was created in November 2012, following an election held on 15 November 2012, and replaced the Essex Police Authority. The incumbent is Roger Hirst, who represents the Conservative Party.
The Hertfordshire Police and Crime Commissioner is the police and crime commissioner, an elected official tasked with setting out the way crime is tackled by Hertfordshire Police in the English County of Hertfordshire. The post was created in November 2012, following an election held on 15 November 2012, and replaced the Hertfordshire Police Authority.
The Surrey Police and Crime Commissioner is the police and crime commissioner, an elected official tasked with setting out the way crime is tackled by Surrey Police in the English County of Surrey. The post was created in November 2012, following an election held on 15 November 2012, and replaced the Surrey Police Authority. The Previous incumbent was David Munro, who represented the Conservative Party. As of 2021, Lisa Townsend is the new Police and Crime Commissioner for Surrey.
The Thames Valley Police and Crime Commissioner (PCC) is a police and crime commissioner, an elected official tasked with setting out the way crime is tackled by Thames Valley Police in the ceremonial English counties of Berkshire, Buckinghamshire and Oxfordshire. The post was created in November 2012, following an election held on 15 November 2012, and replaced the Thames Valley Police Authority. The current incumbent is Matthew Barber, who represents the Conservative Party.
Elections of police and crime commissioners in England and Wales were held on 6 May 2021, on the same day as the Senedd election in Wales and the local elections in England. This was the third time police and crime commissioner elections have been held. The elections were originally due to take place in May 2020 but were postponed by 12 months in view of the COVID-19 pandemic. Turnout was an average of 34.1% across the elections, with Wales having much higher turnout mainly due to the simultaneous Senedd election held across Wales, whereas only parts of England had simultaneous local elections.