| |||||||||||||||||||||||||||||||||||||||||||||||||||||||||||||||||||||
All 36 seats to Havant Borough Council 19 seats needed for a majority | |||||||||||||||||||||||||||||||||||||||||||||||||||||||||||||||||||||
---|---|---|---|---|---|---|---|---|---|---|---|---|---|---|---|---|---|---|---|---|---|---|---|---|---|---|---|---|---|---|---|---|---|---|---|---|---|---|---|---|---|---|---|---|---|---|---|---|---|---|---|---|---|---|---|---|---|---|---|---|---|---|---|---|---|---|---|---|---|
Turnout | 29.79% | ||||||||||||||||||||||||||||||||||||||||||||||||||||||||||||||||||||
| |||||||||||||||||||||||||||||||||||||||||||||||||||||||||||||||||||||
Winner of each seat at the 2024 Havant Borough Council election | |||||||||||||||||||||||||||||||||||||||||||||||||||||||||||||||||||||
|
The 2024 Havant Borough Council election took place on Thursday 2 May 2024, alongside the other local elections in the United Kingdom being held on the same day. All 36 members of Havant Borough Council in Hampshire were elected following boundary changes.
Since its creation in 1974, Havant has been a consistently strong council for the Conservatives. They have held majorities on the council since 1980, aside from periods of no overall control between 1990 and 2002, where the Liberal Democrats became the largest group on the council for 4 years. [2]
In the most recent election, the Conservatives lost 5 seats with 39.4% of the vote, Labour gained 1 with 24.5%, the Liberal Democrats gained 2 with 20.6%, and the Green Party won their first seat with 14.3%.
Havant usually elects its councillors in thirds, on a 4-year cycle. However, following boundary changes, all councillors were elected to the new wards. [3] The change fixes the number of councillors for every ward at 3, which reduces the total number of councillors by 2. Each voter could cast up to three votes. The councillors elected to each ward will serve two, three or four year terms, based on their relative vote share, with the longest term being served by the councillor with the largest number of votes. [3]
Old wards [4] | No. of seats | New wards | No. of seats |
---|---|---|---|
Barncroft | 2 | Bedhampton | 3 |
Battins | 2 | Cowplain | 3 |
Bedhampton | 3 | Emsworth | 3 |
Bondfields | 2 | Hart Plain | 3 |
Cowplain | 3 | Havant St Faith's | 3 |
Emsworth | 3 | Hayling East | 3 |
Hart Plain | 3 | Hayling West | 3 |
Hayling East | 3 | Leigh Park Central and West Leigh | 3 |
Hayling West | 3 | Leigh Park Hermitage | 3 |
Purbrook | 3 | Purbrook | 3 |
St Faith's | 3 | Stakes | 3 |
Stakes | 3 | Waterloo | 3 |
Warren Park | 2 | ||
Waterloo | 3 | ||
After 2023 election | Before 2024 election [5] | After 2024 election | ||||||
---|---|---|---|---|---|---|---|---|
Party | Seats | Party | Seats | Party | Seats | |||
Conservative | 30 | Conservative | 28 | Conservative | 13 | |||
Labour | 4 | Labour | 4 | Labour | 10 | |||
Liberal Democrats | 2 | Liberal Democrats | 2 | Liberal Democrats | 7 | |||
Green | 1 | Green | 1 | Green | 4 | |||
Independent | 1 | Independent | 0 | Independent | 0 | |||
Vacant | 0 | Vacant | 3 | Reform UK | 2 | |||
Changes:
2024 Havant Borough Council election | ||||||||||
---|---|---|---|---|---|---|---|---|---|---|
Party | Candidates | Seats | Gains | Losses | Net gain/loss | Seats % | Votes % | Votes | +/− | |
Conservative | 36 | 13 | 0 | 10 | 17 | 36.1 | 37.8 | 26,370 | −1.6 | |
Labour | 15 | 10 | 2 | 0 | 6 | 27.8 | 18.5 | 12,923 | +3.3 | |
Liberal Democrats | 19 | 7 | 5 | 0 | 5 | 19.4 | 20.7 | 14,455 | +0.1 | |
Green | 19 | 4 | 3 | 0 | 3 | 11.1 | 19.6 | 13,646 | +5.3 | |
Reform UK | 6 | 2 | 0 | 0 | 2 | 5.6 | 2.8 | 1,978 | N/A | |
Independent | 2 | 0 | 0 | 0 | 1 | 0 | 0.6 | 441 | −2.0 |
The Statement of Persons Nominated, which details the candidates standing in each ward, was released by Havant Borough Council following the close of nominations on 5 April 2024. [9]
Party | Candidate | Votes | % | ±% | |
---|---|---|---|---|---|
Liberal Democrats | Philippa Gray* | 1,159 | 47.4 | ||
Liberal Democrats | Michael Lind | 887 | 36.3 | ||
Conservative | Liz Fairhurst* | 767 | 31.4 | ||
Liberal Democrats | Annie Martin | 739 | 30.2 | ||
Conservative | Mark Inkster | 650 | 26.6 | ||
Conservative | Trevor Hughes | 576 | 23.6 | ||
Reform UK | Mark Collins | 493 | 20.2 | ||
Labour | Philip Pearson | 450 | 18.4 | ||
Green | Jim Graham | 348 | 14.2 | ||
Green | Richard Lanchester | 288 | 11.8 | ||
Turnout | 2,448 | 28.02 | |||
Liberal Democrats hold | |||||
Liberal Democrats gain from Conservative | |||||
Conservative hold | |||||
Party | Candidate | Votes | % | ±% | |
---|---|---|---|---|---|
Conservative | David Keast* | 1,021 | 49.0 | ||
Conservative | Neil Bowdell* | 870 | 41.8 | ||
Conservative | Andrew Briggs* | 852 | 40.9 | ||
Labour | Will McGannan | 696 | 33.4 | ||
Green | Bruce Holman | 650 | 31.2 | ||
Liberal Democrats | Christian Notley | 609 | 29.3 | ||
Turnout | 2,106 | 27.45 | |||
Conservative hold | |||||
Party | Candidate | Votes | % | ±% | |
---|---|---|---|---|---|
Green | Grainne Rason* | 2,457 | 64.7 | ||
Green | Reuben Mychaleckyj | 1,976 | 52.1 | ||
Green | Charles Robert | 1,660 | 43.7 | ||
Conservative | Richard Kennett* | 1,364 | 35.9 | ||
Conservative | Carole Bowerman* | 1,177 | 31.0 | ||
Conservative | Lucy Lawrence | 954 | 25.1 | ||
Liberal Democrats | Michael Bolt | 477 | 12.6 | ||
Reform UK | John Davis | 287 | 7.6 | ||
Liberal Democrats | Adam Bowman | 285 | 7.5 | ||
Turnout | 3,808 | 45.18 | |||
Green hold | |||||
Green gain from Conservative | |||||
Green gain from Conservative |
Party | Candidate | Votes | % | ±% | |
---|---|---|---|---|---|
Conservative | Ann Briggs | 777 | 40.3 | ||
Conservative | Elaine Shimbart* | 768 | 39.8 | ||
Conservative | James Blades* | 654 | 33.9 | ||
Liberal Democrats | Jules Ashley | 570 | 29.5 | ||
Labour | John Colman | 563 | 29.2 | ||
Green | Peter May | 432 | 22.4 | ||
Reform UK | Jonathan Harvey | 365 | 18.9 | ||
Turnout | 1,942 | 24.92 | |||
Conservative hold | |||||
Party | Candidate | Votes | % | ±% | |
---|---|---|---|---|---|
Labour | Phil Munday* | 1,845 | 57.7 | ||
Labour | Gillian Harris* | 1,728 | 54.1 | ||
Labour | Daniel Berwick | 1,568 | 49.1 | ||
Conservative | John Dyer | 846 | 26.5 | ||
Conservative | Nigel Chilcott | 785 | 24.6 | ||
Conservative | Maurice Knowles | 630 | 19.7 | ||
Green | Nick Saunders | 582 | 18.2 | ||
Reform UK | Dave Etherington | 515 | 16.1 | ||
Independent | Giles Harris | 231 | 7.2 | ||
Turnout | 3,212 | 36.48 | |||
Labour win (new seat) | |||||
Labour win (new seat) |
Party | Candidate | Votes | % | ±% | |
---|---|---|---|---|---|
Labour | Mark Coates* | 1,459 | 54.6 | ||
Green | Netty Shepherd | 992 | 37.1 | ||
Labour | Peter Oliver | 839 | 31.4 | ||
Conservative | Geoffrey Hartridge | 806 | 30.2 | ||
Green | Natasha Parker | 751 | 28.1 | ||
Conservative | Eric Cundliffe | 732 | 27.4 | ||
Conservative | Shola Attryde | 610 | 22.8 | ||
Green | Judy Valentine | 570 | 21.3 | ||
Turnout | 2,710 | 37.17 | |||
Labour hold | |||||
Green gain from Conservative | |||||
Labour gain from Conservative |
Party | Candidate | Votes | % | ±% | |
---|---|---|---|---|---|
Liberal Democrats | Paul Gray* | 1,818 | 63.9 | ||
Liberal Democrats | Wilf Forrow | 1,678 | 59.0 | ||
Liberal Democrats | Jonathan Hulls | 1,586 | 55.8 | ||
Conservative | Julie Richardson* | 784 | 27.6 | ||
Conservative | Brenda Linger* | 765 | 26.9 | ||
Conservative | Edward Rees | 584 | 20.5 | ||
Green | Aaron Bradbury | 367 | 12.9 | ||
Green | Rob Soar | 275 | 9.7 | ||
Turnout | 2,867 | 41.80 | |||
Liberal Democrats hold | |||||
Liberal Democrats gain from Conservative | |||||
Liberal Democrats gain from Conservative |
Party | Candidate | Votes | % | ±% | |
---|---|---|---|---|---|
Labour | Jason Horton | 655 | 40.8 | ||
Labour | Munazza Faiz | 521 | 32.5 | ||
Reform UK | Sharon Collings | 430 | 26.8 | ||
Conservative | Alex Rennie | 420 | 26.2 | ||
Conservative | Richard Stone | 415 | 25.9 | ||
Green | Cayleigh Arnold | 363 | 22.6 | ||
Conservative | Kris Tindall | 338 | 21.1 | ||
Liberal Democrats | Jo Lowe | 279 | 17.4 | ||
Liberal Democrats | Glenda Dunford | 238 | 14.8 | ||
Independent | Malc Carpenter | 210 | 13.1 | ||
Turnout | 1,610 | 18.73 | |||
Labour win (new seat) | |||||
Reform UK win (new seat) |
Party | Candidate | Votes | % | ±% | |
---|---|---|---|---|---|
Labour | Richard Brown | 499 | 37.9 | ||
Labour | Amy Redsull-Aveline* | 472 | 35.9 | ||
Reform UK | Vicky Rhodes | 381 | 29.0 | ||
Conservative | Jackie Branson | 358 | 27.2 | ||
Conservative | Pam Crellin | 346 | 26.3 | ||
Conservative | Yvonne Weeks | 337 | 25.6 | ||
Green | Rayner Piper | 252 | 19.2 | ||
Liberal Democrats | Maria Mleczko-Miller | 227 | 17.3 | ||
Turnout | 1,319 | 15.17 | |||
Labour win (new seat) | |||||
Reform UK win (new seat) |
Party | Candidate | Votes | % | ±% | |
---|---|---|---|---|---|
Liberal Democrats | Antonia Harrison | 979 | 48.2 | ||
Liberal Democrats | Paul Tansom | 933 | 45.9 | ||
Conservative | Caren Diamond* | 802 | 39.5 | ||
Conservative | Terry Norton | 725 | 35.7 | ||
Conservative | Husky Patel* | 705 | 34.7 | ||
Liberal Democrats | George Kneller | 649 | 32.0 | ||
Green | Susan James | 444 | 21.9 | ||
Turnout | 2,058 | 27.91 | |||
Liberal Democrats gain from Conservative | |||||
Conservative hold | |||||
Party | Candidate | Votes | % | ±% | |
---|---|---|---|---|---|
Conservative | Elizabeth Lloyd* | 741 | 45.7 | ||
Conservative | Sarah Milne* | 682 | 42.1 | ||
Labour | Simon Hagan | 624 | 38.5 | ||
Conservative | Diana Patrick* | 599 | 37.0 | ||
Labour | David Hill | 501 | 30.9 | ||
Green | Paul Briley | 420 | 25.9 | ||
Liberal Democrats | Crispin Ward | 396 | 24.4 | ||
Turnout | 1,633 | 21.57 | |||
Conservative hold | |||||
Labour gain from Conservative |
Party | Candidate | Votes | % | ±% | |
---|---|---|---|---|---|
Conservative | Ryan Brent | 1,023 | 48.8 | ||
Conservative | Peter Wade* | 977 | 46.6 | ||
Conservative | Gwen Robinson* | 930 | 44.4 | ||
Liberal Democrats | Jane Briggs | 529 | 25.3 | ||
Labour | Darren Corps | 503 | 24.0 | ||
Green | Owen Plumkett | 484 | 23.1 | ||
Liberal Democrats | John Pratley | 417 | 19.9 | ||
Green | Neil Attewell | 335 | 16.0 | ||
Turnout | 2,122 | 28.30 | |||
Conservative hold | |||||
Three Rivers is a local government district in south-west Hertfordshire, England. Its council is based in Rickmansworth. The district borders Hertsmere, Watford, St Albans, Dacorum, Buckinghamshire, and the London boroughs of Hillingdon and Harrow.
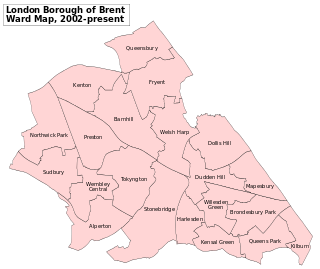
Brent London Borough Council in London, England is elected every four years. Since the last boundary changes in 2022 the council has comprised 57 councillors representing 22 wards, with each ward electing two or three councillors.
The Borough of Havant is a local government district with borough status in Hampshire, England. Its council is based in Havant. Other towns and villages within the borough include Bedhampton, Cowplain, Emsworth, Hayling Island, Purbrook, Waterlooville and Widley. The borough covers much of the semi-urban area in the south east of Hampshire, between the city of Portsmouth and the West Sussex border.
North Tyneside Council is the local authority for the metropolitan borough of North Tyneside in Tyne and Wear, England. It is one of five such councils in Tyne and Wear, and one of 36 in England. It provides the majority of local government services in North Tyneside.
One third of Havant Borough Council in Hampshire, England is elected each year, followed by one year without election. Since the last boundary changes in 2002, 38 councillors have been elected from 14 wards.
The 2012 Havant Borough Council election took place on 3 May 2012 to elect members of Havant Borough Council in Hampshire, England. One third of the council was up for election and the Conservative Party stayed in overall control of the council.
The 2018 London local elections took place in London on 3 May 2018 as part of wider local elections in England. All London borough councillor seats were up for election. Elections to the Corporation of London were held in 2017. Mayoral contests were also held in Hackney, Lewisham, Newham and Tower Hamlets. The previous London borough elections were in 2014.
The 2019 Redcar and Cleveland Borough Council election took place on 2 May 2019 to elect members of Redcar and Cleveland Borough Council in England. This was on the same day as other local elections.
Elections to Hampshire County Council took on 6 May 2021 as part of the 2021 United Kingdom local elections. All 78 seats were up for election, with each ward returning either one or two councillors by first-past-the-post voting for a four-year term of office. This took place at the same time as the elections for the Hampshire Police and Crime Commissioner and district councils.
The 2022 Birmingham City Council election took place on 5 May 2022, with all 101 council seats up for election across 37 single-member and 32 two-member wards. The election was held alongside other local elections across Great Britain and town council elections in Sutton Coldfield.
The 2022 Hackney London Borough Council election took place on 5 May 2022. All 57 members of Hackney London Borough Council were up for election. The elections took place alongside the election for the mayor of Hackney, local elections in the other London boroughs, and elections to local authorities across the United Kingdom.
The 2022 Islington London Borough Council election took place on 5 May 2022. All 51 members of Islington London Borough Council were to be elected. The elections took place alongside local elections in the other London boroughs and elections to local authorities across the United Kingdom.
The 2022 Lewisham London Borough Council election took place on 5 May 2022. All 54 members of Lewisham London Borough Council were up for election. The elections took place alongside local elections in the other London boroughs and elections to local authorities across the United Kingdom.
The 2022 Manchester City Council election took place on 5 May 2022. One third of councillors on Manchester City Council were elected. This election was a part of the other local elections across the United Kingdom.
The 2024 North Tyneside Metropolitan Borough Council election was held on Thursday 2 May 2024, alongside the other local elections held in the United Kingdom on the same day. All seats in all wards were up for election. Labour retained its majority on the council.
The 2024 Brentwood Borough Council election is scheduled to be held on Thursday 2 May 2024, alongside the other local elections in the United Kingdom being held on the same day. All 39 members of Brentwood Borough Council in Essex will be elected following boundary changes.
The 2024 Bolton Metropolitan Borough Council election will take place on 2 May 2024. One third of councillors are to be elected. The election will take place alongside other local elections across the United Kingdom.
The 2024 Barnsley Metropolitan Borough Council election was held on Thursday 2 May 2024, alongside the other local elections across the United Kingdom being held on the same day.
The 2024 Calderdale Metropolitan Borough Council election was held on Thursday 2 May 2024, alongside the other local elections across the United Kingdom being held on the same day.
The 2024 Gosport Borough Council election is scheduled to be held on Thursday 2 May 2024, alongside the other local elections in the United Kingdom being held on the same day. One-half of the 28 members of Gosport Borough Council in Hampshire will be elected, as well as a vacancy in Lee West ward.