| |||||||||||||||||||||||||||||||||||||||||||||||||||||||||
17 of 51 seats on Calderdale Metropolitan Borough Council 26 seats needed for a majority | |||||||||||||||||||||||||||||||||||||||||||||||||||||||||
---|---|---|---|---|---|---|---|---|---|---|---|---|---|---|---|---|---|---|---|---|---|---|---|---|---|---|---|---|---|---|---|---|---|---|---|---|---|---|---|---|---|---|---|---|---|---|---|---|---|---|---|---|---|---|---|---|---|
Turnout | 34.8 ( 21.4) | ||||||||||||||||||||||||||||||||||||||||||||||||||||||||
| |||||||||||||||||||||||||||||||||||||||||||||||||||||||||
Results by ward | |||||||||||||||||||||||||||||||||||||||||||||||||||||||||
|
The 2024 Calderdale Metropolitan Borough Council election was held on Thursday 2 May 2024, alongside the other local elections across the United Kingdom being held on the same day.
The Local Government Act 1972 created a two-tier system of metropolitan counties and districts covering Greater Manchester, Merseyside, South Yorkshire, Tyne and Wear, the West Midlands, and West Yorkshire starting in 1974. Calderdale was a district of the West Yorkshire metropolitan county. [1] The Local Government Act 1985 abolished the metropolitan counties, with metropolitan districts taking on most of their powers as metropolitan boroughs. The West Yorkshire Combined Authority was established in 2014 and began electing the mayor of West Yorkshire in 2021. [2]
Calderdale Council was under no overall control with Conservative, Liberal Democrat and Labour leaders until the Labour Party achieved a majority of seats in the 2019 election, when they gained four seats to hold 28 of the council's 51 seats. In the most recent election in 2023, seventeen seats were up for election. Labour won ten seats, the Conservatives won four seats, Liberal Democrats won two seats and the Greens won one seat. [3]
Seats up for election in 2024 were last elected in 2021. These elections were originally scheduled for 2020, but were delayed by a year due to the COVID-19 pandemic. [4] In that election, the Conservatives won nine seats, Labour won eight, and the Liberal Democrats won two. Labour retained its majority on the council at this election. [5]
The council elects its councillors in thirds, with a third being up for election for three consecutive years and no election in the fourth year. [6] [7] The election used first-past-the-post voting, with wards generally being represented by three councillors, with one elected in each election year to serve a four-year term.
All registered electors (British, Irish, Commonwealth and European Union citizens) living in Calderdale aged 18 or over were entitled to vote in the election. People who live at two addresses in different councils, such as university students with different term-time and holiday addresses, are entitled to be registered for and vote in elections in both local authorities. Voting in-person at polling stations took place from 07:00 to 22:00 on election day, and voters were able to apply for postal votes or proxy votes in advance of the election.
2024 Calderdale Metropolitan Borough Council election [8] | ||||||||||
---|---|---|---|---|---|---|---|---|---|---|
Party | This election | Full council | This election | |||||||
Seats | Net | Seats % | Other | Total | Total % | Votes | Votes % | +/− | ||
Labour | 10 | 3 | 58.8 | 20 | 29 | 56.9 | 21,418 | 41.1 | +3.8 | |
Conservative | 3 | 6 | 17.6 | 5 | 11 | 21.6 | 13,585 | 26.1 | -12.9 | |
Liberal Democrats | 2 | 11.8 | 4 | 6 | 11.8 | 5,556 | 10.7 | -0.6 | ||
Independent | 0 | 0.0 | 1 | 1 | 2.0 | 835 | 1.6 | -1.7 | ||
Green | 1 | 1 | 5.9 | 2 | 3 | 5.9 | 8,311 | 16.0 | +7.7 | |
Workers Party | 1 | 1 | 5.9 | 0 | 1 | 2.0 | 1,643 | 3.2 | New | |
Freedom Alliance | 0 | 0.0 | 0 | 0 | 0.0 | 139 | 0.3 | +0.2 | ||
Prior to the election the composition of the council was:
27 | 14 | 6 | 2 | 1 | 1 |
Labour | Conservative | Lib Dem | Green | Ind | Vac |
After the election the composition of the council was:
29 | 11 | 6 | 3 | 1 | 1 |
Labour | Conservative | Lib Dem | Green | Ind | WPB |
After 2023 election | Before 2024 election | After 2024 election | ||||||
---|---|---|---|---|---|---|---|---|
Party | Seats | Party | Seats | Party | Seats | |||
Labour | 28 | Labour | 27 | Labour | 29 | |||
Conservative | 15 | Conservative | 14 | Conservative | 11 | |||
Liberal Democrats | 6 | Liberal Democrats | 6 | Liberal Democrats | 6 | |||
Green | 2 | Green | 2 | Green | 3 | |||
Independent | 0 | Independent & vacant | 2 | Independent & other | 2 |
Changes between 2023 & 2024:
Incumbent councillors are marked with an asterisk.
Party | Candidate | Votes | % | ±% | |
---|---|---|---|---|---|
Conservative | Geraldine Carter | 1,163 | 40.8 | -10.9 | |
Labour | Frank Darnley | 1,078 | 37.8 | +9.5 | |
Green | Kim Atkinson | 445 | 15.6 | +5.6 | |
Liberal Democrats | Jennie Rigg | 126 | 4.4 | +0.9 | |
Majority | 85 | 3.0 | -13.7 | ||
Rejected ballots | 40 | 1.4 | |||
Turnout | 2,852 | 34.6 | -10.7 | ||
Registered electors | 8,249 | ||||
Conservative hold | Swing | ||||
Party | Candidate | Votes | % | ±% | |
---|---|---|---|---|---|
Labour Co-op | Josh Fenton-Glynn* | 3,008 | 67.0 | +1.0 | |
Green | Mark Stanley | 638 | 14.2 | +4.9 | |
Conservative | Christopher Lee | 574 | 12.8 | -5.4 | |
Liberal Democrats | Chris Wadsworth | 222 | 4.9 | +0.6 | |
Majority | 2,370 | 52.7 | +4.9 | ||
Rejected ballots | 53 | 1.2 | |||
Turnout | 4,495 | 48.7 | -6.7 | ||
Registered electors | 9,239 | ||||
Labour hold | Swing | ||||
Party | Candidate | Votes | % | ±% | |
---|---|---|---|---|---|
Conservative | Peter Hunt | 786 | 30.9 | -5.8 | |
Labour | Khuram Majid | 700 | 27.5 | -7.3 | |
Liberal Democrats | Richard Phillips | 574 | 22.5 | +1.3 | |
Green | Barry Crossland | 446 | 17.5 | +10.8 | |
Majority | 86 | 3.4 | +1.5 | ||
Rejected ballots | 40 | 1.6 | |||
Turnout | 2,546 | 28.7 | -9.2 | ||
Registered electors | 8,878 | ||||
Conservative hold | Swing | ||||
Party | Candidate | Votes | % | ±% | |
---|---|---|---|---|---|
Liberal Democrats | Paul Bellenger* | 1,526 | 50.6 | -8.2 | |
Conservative | Alex Greenwood | 806 | 26.7 | -6.4 | |
Labour | Mark Pitkethly | 420 | 13.9 | -0.2 | |
Green | Jacquelyn Haigh | 240 | 8.0 | -1.6 | |
Majority | 720 | 23.9 | +23.2 | ||
Rejected ballots | 26 | 0.9 | |||
Turnout | 3,018 | 35.5 | -16.9 | ||
Registered electors | 8,503 | ||||
Liberal Democrats hold | Swing | ||||
Party | Candidate | Votes | % | ±% | |
---|---|---|---|---|---|
Conservative | George Robinson* | 1,846 | 57.0 | -10.5 | |
Labour | Sam Ackroyd | 934 | 28.8 | +5.9 | |
Green | Catherine Graham | 299 | 9.2 | +2.5 | |
Liberal Democrats | Nikki Stocks | 122 | 3.8 | +1.5 | |
Majority | 912 | 28.2 | -16.4 | ||
Rejected ballots | 37 | 1.2 | |||
Turnout | 3,238 | 35.2 | -8.6 | ||
Registered electors | 9,208 | ||||
Conservative hold | Swing | ||||
Party | Candidate | Votes | % | ±% | |
---|---|---|---|---|---|
Labour | Shane Taylor | 1,168 | 49.5 | +10.3 | |
Conservative | Stephen Padgett | 640 | 27.1 | -15.3 | |
Green | Laura Beesley | 169 | 7.2 | +4.1 | |
Independent | Seán Loftus | 143 | 6.1 | +4.4 | |
Independent | Sara Gaunt | 135 | 5.7 | New | |
Liberal Democrats | Nicholas Proctor | 79 | 3.3 | +1.7 | |
Majority | 528 | 22.4 | 19.2 | ||
Rejected ballots | 25 | 1.1 | |||
Turnout | 2,359 | 25.3 | -6.6 | ||
Registered electors | 9,319 | ||||
Labour gain from Conservative | Swing | ||||
Party | Candidate | Votes | % | ±% | |
---|---|---|---|---|---|
Labour | Jane Scullion* | 1,862 | 57.7 | +12.1 | |
Conservative | Jill Smith-Moorhouse | 731 | 22.6 | -13.2 | |
Liberal Democrats | Christine Bampton-Smith | 307 | 9.5 | -0.3 | |
Green | Kate Sweeny | 295 | 9.1 | +0.9 | |
Majority | 1,131 | 35.0 | +25.3 | ||
Rejected ballots | 33 | 1.0 | |||
Turnout | 3,228 | 40.5 | -7.1 | ||
Registered electors | 7,965 | ||||
Labour hold | Swing | ||||
Party | Candidate | Votes | % | ±% | |
---|---|---|---|---|---|
Green | Elaine Hey | 2,275 | 67.6 | +43.7 | |
Conservative | John Vaughan | 737 | 21.9 | -36.2 | |
Labour | Allen Slingsby | 327 | 9.7 | -6.1 | |
Majority | 1,538 | 45.7 | +11.5 | ||
Rejected ballots | 28 | 0.8 | |||
Turnout | 3,367 | 37.0 | -4.4 | ||
Registered electors | 9,106 | ||||
Green gain from Conservative | Swing | ||||
Party | Candidate | Votes | % | ±% | |
---|---|---|---|---|---|
Labour Co-op | Danielle Durrans* | 919 | 55.3 | +10.1 | |
Conservative | Anne Baines | 358 | 21.5 | -15.9 | |
Liberal Democrats | Sean Bamforth | 188 | 11.3 | ||
Green | Finn Jensen | 166 | 9.9 | +4.6 | |
Majority | 561 | 33.7 | +25.9 | ||
Rejected ballots | 32 | 1.92 | |||
Turnout | 1,663 | 19.7 | -5.9 | ||
Registered electors | 8,422 | ||||
Labour hold | Swing | ||||
Party | Candidate | Votes | % | ±% | |
---|---|---|---|---|---|
Workers Party | Shakir Saghir | 1,643 | 43.9 | New | |
Green | Sabir Hussain | 953 | 25.4 | +22.2 | |
Labour | Sadia Zaman | 758 | 20.2 | -40.4 | |
Liberal Democrats | Samuel Jackson | 190 | 5.1 | +2.5 | |
Conservative | Naveed Khan | 164 | 4.4 | -28.7 | |
Majority | 690 | 18.4 | -9.1 | ||
Rejected ballots | 38 | 1.0 | |||
Turnout | 3,746 | 39.1 | -2.3 | ||
Registered electors | 9,576 | ||||
Workers Party gain from Labour | Swing | ||||
Party | Candidate | Votes | % | ±% | |
---|---|---|---|---|---|
Labour Co-op | Alan Judge | 1,317 | 45.4 | +15.6 | |
Conservative | Joseph Matthews | 1,151 | 39.6 | -18.6 | |
Green | Andrew Bramley | 237 | 8.2 | -0.8 | |
Liberal Democrats | Bernardette Stancliffe | 165 | 5.7 | +3.2 | |
Majority | 166 | 5.7 | -22.7 | ||
Rejected ballots | 34 | 1.2 | |||
Turnout | 2,904 | 35.0 | -8.4 | ||
Registered electors | 8,300 | ||||
Labour gain from Conservative | Swing | ||||
Party | Candidate | Votes | % | ±% | |
---|---|---|---|---|---|
Labour | Leah Webster | 1,554 | 48.2 | +27.2 | |
Conservative | Robert Thornber* | 1,270 | 39.4 | -7.7 | |
Green | Cordelia Prescott | 197 | 6.1 | +0.6 | |
Liberal Democrats | Rosemary Tatchell | 165 | 5.1 | +2.6 | |
Majority | 284 | 8.8 | -15.9 | ||
Rejected ballots | 41 | 1.27 | |||
Turnout | 3,227 | 36.0 | -6.2 | ||
Registered electors | 8,962 | ||||
Labour gain from Conservative | Swing | ||||
Party | Candidate | Votes | % | ±% | |
---|---|---|---|---|---|
Labour Co-op | Ann Kingstone* | 1,932 | 51.1 | +1.8 | |
Conservative | Oliver Gibson | 950 | 25.1 | -10.0 | |
Green | Robert Orange | 558 | 14.8 | -3.9 | |
Liberal Democrats | Michael Holdsworth | 309 | 8.2 | +2.0 | |
Majority | 982 | 26.0 | +11.8 | ||
Rejected ballots | 34 | 0.9 | |||
Turnout | 3,783 | 39.1 | -6.1 | ||
Registered electors | 9,685 | ||||
Labour hold | Swing | ||||
Party | Candidate | Votes | % | ±% | |
---|---|---|---|---|---|
Labour | Adam Wilkinson* | 1,702 | 58.5 | +6.2 | |
Conservative | Mark Edwards | 695 | 23.9 | -12.9 | |
Green | David Booth | 295 | 10.1 | +3.2 | |
Liberal Democrats | Diana Harris | 167 | 5.7 | +2.5 | |
Majority | 1,007 | 34.6 | +19.2 | ||
Rejected ballots | 50 | 1.7 | |||
Turnout | 2,909 | 33.0 | -6.5 | ||
Registered electors | 8,820 | ||||
Labour hold | Swing | ||||
Party | Candidate | Votes | % | ±% | |
---|---|---|---|---|---|
Labour Co-op | Diana Tremayne* | 1,919 | 60.9 | +9.4 | |
Conservative | Brian Carter | 525 | 16.7 | -5.0 | |
Green | Kieran Turner | 495 | 15.7 | +6.2 | |
Liberal Democrats | Abdul Kye | 160 | 5.1 | -9.5 | |
Majority | 1,394 | 44.2 | +14.5 | ||
Rejected ballots | 52 | 1.7 | |||
Turnout | 3,151 | 35.1 | -6.5 | ||
Registered electors | 8,983 | ||||
Labour hold | Swing | ||||
Party | Candidate | Votes | % | ±% | |
---|---|---|---|---|---|
Labour Co-op | Kelly Thornham | 1,160 | 47.0 | -2.7 | |
Conservative | Vishal Gupta | 839 | 34.0 | +1.1 | |
Green | Elliot Hey | 329 | 13.3 | +1.9 | |
Liberal Democrats | Garry Prashad | 103 | 4.2 | -0.9 | |
Majority | 321 | 13.0 | -3.8 | ||
Rejected ballots | 36 | 1.5 | |||
Turnout | 2,467 | 26.9 | -4.0 | ||
Registered electors | 9,173 | ||||
Labour hold | Swing | ||||
Party | Candidate | Votes | % | ±% | |
---|---|---|---|---|---|
Liberal Democrats | Ashley Evans* | 1,153 | 36.5 | -5.7 | |
Labour | Ben Jancovich | 660 | 20.9 | -10.4 | |
Independent | Sohail Ashfaq | 557 | 17.6 | New | |
Conservative | Stephen Baines | 350 | 11.1 | -9.9 | |
Green | Katie Witham | 274 | 8.7 | +3.8 | |
Freedom Alliance | Martin Davies | 139 | 4.4 | New | |
Majority | 493 | 15.6 | +4.7 | ||
Rejected ballots | 26 | 0.8 | |||
Turnout | 3,159 | 34.3 | -4.7 | ||
Registered electors | 9,209 | ||||
Liberal Democrats hold | Swing | ||||
Elections to Calderdale Metropolitan Borough Council were held on 3 May 2007 with the exception of the Warley ward which was postponed until 14 June 2007 due to the sudden death of one of the candidates. One third of the council was up for election and the council stayed under no overall control with a minority Conservative administration. The total turnout of the election was 38.01%. The winning candidate in each ward is highlighted in bold.
The 2016 Calderdale Metropolitan Borough Council election took place on 5 May 2016 to elect members of Calderdale Metropolitan Borough Council in England. This was on the same day as other local elections. One councillor was elected in each ward for a four-year term so the councillors elected in 2016 last stood for election in 2012. Each ward is represented by three councillors, the election of which is staggered, so only one third of the councillors was elected in this election. Before the election there was no overall control with a minority Labour administration. After the election there was still no overall control so the minority Labour administration continued.
The 2021 Calderdale Metropolitan Borough Council election took place on 6 May 2021 to elect members of Calderdale Metropolitan Borough Council in England. This was on the same day as other local elections. One-third of the seats were up for election.
The 2022 Birmingham City Council election took place on 5 May 2022, with all 101 council seats up for election across 37 single-member and 32 two-member wards. The election was held alongside other local elections across Great Britain and town council elections in Sutton Coldfield.
The 2022 Bury Metropolitan Borough Council election took place on 5 May 2022. Due to boundary changes, all 51 councillors were elected at the same time. The election took place alongside other local elections across the United Kingdom.
The 2022 Rochdale Metropolitan Borough Council election took place as of 5 May 2022. Due to boundary changes, all 60 councillors were elected at the same time. The election took place alongside other local elections across the United Kingdom.
The 2022 St Helens Metropolitan Borough Council election took place on 5 May 2022. Due to boundary changes, all 48 councillors were elected at the same time, with the council moving to a system of all-out elections every four years. The election took place alongside other local elections across the United Kingdom.
The 2022 Barnsley Metropolitan Borough Council election took place on 5 May 2022. One third of councillors — 21 out of 63 — were elected. The election took place alongside the 2022 South Yorkshire mayoral election and other local elections across the United Kingdom.
The 2022 City of Bradford Metropolitan District Council election took place on 5 May 2022 to elect one third of councillors to the City of Bradford Metropolitan District Council. The election took place at the same time as other local elections across the United Kingdom.
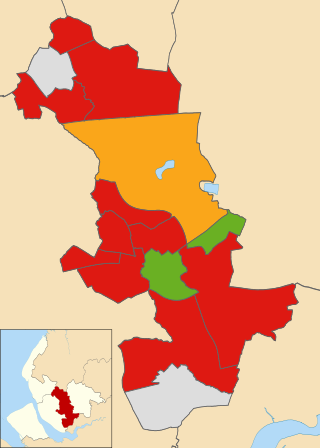
The 2022 Calderdale Metropolitan Borough Council election took place on 5 May 2022 to elect members of Calderdale Metropolitan Borough Council in England. One third of councillors — 17 out of 51, plus one vacancy in Ovenden ward were up for election. The election took place alongside other local elections across the United Kingdom.
The 2022 Gateshead Metropolitan Borough Council election took place on 5 May 2022. One third of councillors — 22 out of 66 — on Gateshead Metropolitan Borough Council were elected. The election took place alongside other local elections across the United Kingdom.
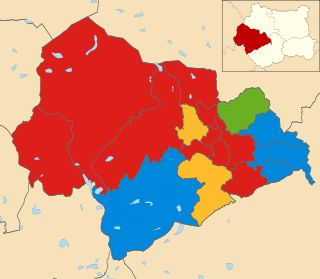
The 2022 Kirklees Metropolitan Borough Council election took place on 5 May 2022. One third of councillors—23 out of 69—on Kirklees Metropolitan Borough Council were elected. The election took place alongside other local elections across the United Kingdom.
The 2022 Knowsley Metropolitan Borough Council election took place on 5 May 2022. One third of councillors — 15 out of 45 — on Knowsley Metropolitan Borough Council were elected. The election took place alongside other local elections across the United Kingdom.
The 2022 Oldham Metropolitan Borough Council election took place on 5 May 2022. One third—20 out of 60—of councillors on Oldham Council was elected. The election took place alongside other local elections across the United Kingdom.
The 2022 Salford City Council election took place on 5 May 2022 along with other local elections across the United Kingdom. One third—20 out of 60—of councillor seats on Salford City Council were up for election.
Elections to Calderdale Metropolitan Borough Council took place on 4 May 2023 alongside other elections in the United Kingdom. Labour retained its majority on the council.
The 2024 United Kingdom local elections took place on 2 May 2024 to choose around 2,600 councillors on 107 councils in England, 11 directly elected mayors in England, the 25 members of the London Assembly, and 37 police and crime commissioners in England and Wales. The 2024 Blackpool South parliamentary by-election was held on the same day.
The 2024 Barnsley Metropolitan Borough Council election was held on Thursday 2 May 2024, alongside the other local elections across the United Kingdom being held on the same day.
The 2024 City of Bradford Metropolitan District Council election took place on 2 May 2024. One third of councillors were elected. The election took place alongside other local elections across England and Wales.