| ||||||||||||||||||||||||||||||||||||||||||||||||||||||||||||||||||||||||||||||||||||||||||||||||
17 out of 51 seats to Southend-on-Sea City Council 26 seats needed for a majority | ||||||||||||||||||||||||||||||||||||||||||||||||||||||||||||||||||||||||||||||||||||||||||||||||
---|---|---|---|---|---|---|---|---|---|---|---|---|---|---|---|---|---|---|---|---|---|---|---|---|---|---|---|---|---|---|---|---|---|---|---|---|---|---|---|---|---|---|---|---|---|---|---|---|---|---|---|---|---|---|---|---|---|---|---|---|---|---|---|---|---|---|---|---|---|---|---|---|---|---|---|---|---|---|---|---|---|---|---|---|---|---|---|---|---|---|---|---|---|---|---|---|
| ||||||||||||||||||||||||||||||||||||||||||||||||||||||||||||||||||||||||||||||||||||||||||||||||
Winner of each seat at the 2024 Southend-on-Sea City Council election | ||||||||||||||||||||||||||||||||||||||||||||||||||||||||||||||||||||||||||||||||||||||||||||||||
|
The 2024 Southend-on-Sea City Council election was held on Thursday 2 May 2024, alongside the other local elections in the United Kingdom being held on the same day. One-third of the 51 members of Southend-on-Sea City Council in Essex were elected.
The Conservative Party took control of Southend-on-Sea from no overall control in 2000, [1] and governed as a majority until 2014 when they were replaced by a coalition of Labour, Liberal Democrats and independents. [2] The Conservatives took control alongside UKIP in 2016, [2] before regaining a majority in 2018. The Labour-Liberal Democrats-independent coalition took over in 2019, [3] and governed until 2023. In that election, the Conservatives won 5 seats with 33.2%, Labour won 7 with 28.7%, independents won 3 with 12.3%, the Liberal Democrats won 1 with 13.2%, and the Green Party won 1 with 9.1%. The Conservatives formed a minority administration with support of some independents following this election. [4]
The seats up for election in 2024 were last contested in 2021; because of the delay of all local elections due to the COVID-19 pandemic, the seats are up for election after 3 years rather than the usual 4. In that election, the Conservatives won 11 seats with 40.5%, Labour won 6 with 26.1%, independents won 1 with 13.0% and the Liberal Democrats won 1 with 11.4%.
After 2023 election | Before 2024 election [5] | After 2024 election | ||||||
---|---|---|---|---|---|---|---|---|
Party | Seats | Party | Seats | Party | Seats | |||
Conservative | 22 | Conservative | 22 | Conservative | 18 | |||
Labour | 17 | Labour | 16 | Labour | 20 | |||
Liberal Democrats | 4 | Liberal Democrats | 4 | Liberal Democrats | 4 | |||
Green | 1 | Green | 1 | Green | 2 | |||
Independent | 7 | Independent | 8 | Independent | 7 |
Changes:
Councillor | Ward | First elected | Party | Date announced |
---|---|---|---|---|
Derek Jarvis | West Shoebury Ward | Conservative | 25 March 2024 [7] | |
Chris Walker | Eastwood Park | 1997 | Conservative | 21 October 2021 |
Steve Buckley | St Laurence | 2015 | Conservative | |
John Lamb | West Leigh | Conservative | ||
Stephen George | Milton | 1999 | Labour | |
Mike Stafford | Thorpe | Independent |
2024 Southend-on-Sea City Council election | ||||||||||
---|---|---|---|---|---|---|---|---|---|---|
Party | This election | Full council | This election | |||||||
Seats | Net | Seats % | Other | Total | Total % | Votes | Votes % | +/− | ||
Labour | 7 | 4 | 41.2 | 13 | 20 | 39.2 | 12,702 | 31.6 | +2.9 | |
Conservative | 7 | 4 | 41.2 | 11 | 18 | 35.3 | 12,406 | 30.9 | –2.3 | |
Independent | 1 | 1 | 5.9 | 6 | 7 | 13.7 | 3,572 | 8.9 | –3.4 | |
Liberal Democrats | 1 | 5.9 | 3 | 4 | 7.8 | 4,351 | 10.8 | –2.4 | ||
Green | 1 | 1 | 5.9 | 1 | 2 | 3.9 | 5,434 | 13.5 | +4.4 | |
Confelicity | 0 | 0.0 | 0 | 0 | 0.0 | 1,307 | 3.3 | +0.4 | ||
Heritage | 0 | 0.0 | 0 | 0 | 0.0 | 420 | 1.0 | +0.7 | ||
Results of the City Council election were released by Southend-on-Sea City Council on 3rd May 2024. [8]
Seat changes are compared to the 2023 election and do not take into account interim changes due to by-elections or defections.
Party | Candidate | Votes | % | ±% | |
---|---|---|---|---|---|
Conservative | Jack Warren* | 1,006 | 39.2 | +5.9 | |
Green | Nathaniel Love | 693 | 27.0 | +21.5 | |
Independent | Gareth Evans | 419 | 16.3 | N/A | |
Labour | Graham Main | 320 | 12.5 | +1.5 | |
Liberal Democrats | Stephen Cummins | 86 | 3.4 | –1.1 | |
Confelicity | Lizzie Smith | 32 | 1.2 | +0.4 | |
Majority | 313 | 12.2 | N/A | ||
Turnout | 2,565 | 34.9 | –1.4 | ||
Conservative hold | Swing | 7.8 | |||
Party | Candidate | Votes | % | ±% | |
---|---|---|---|---|---|
Labour Co-op | Shahid Nadeem | 1,089 | 40.0 | +5.9 | |
Conservative | Helen Boyd* | 677 | 24.9 | –2.9 | |
Independent | Keith Evans | 561 | 20.6 | –6.8 | |
Green | AJ Sutherland | 223 | 8.2 | +1.7 | |
Liberal Democrats | Pamela Austin | 103 | 3.8 | +0.6 | |
Heritage | Lynn Smith | 28 | 1.0 | N/A | |
Confelicity | Luis Lancos | 26 | 1.0 | –0.1 | |
Majority | 412 | 15.1 | +8.8 | ||
Turnout | 2,722 | 33.7 | +1.8 | ||
Labour Co-op gain from Conservative | Swing | 4.4 | |||
Party | Candidate | Votes | % | ±% | |
---|---|---|---|---|---|
Conservative | James Courtenay* | 975 | 40.8 | –6.7 | |
Labour | Mike O'Connor | 868 | 36.3 | +4.7 | |
Green | James Vessey-Miller | 331 | 13.9 | +3.9 | |
Liberal Democrats | Christopher Hind | 130 | 5.4 | –2.4 | |
Confelicity | Roma Patel | 73 | 3.05 | ±0.0 | |
Majority | 107 | 4.5 | –11.4 | ||
Turnout | 2,388 | 33.7 | –0.3 | ||
Conservative hold | Swing | 5.7 | |||
Party | Candidate | Votes | % | ±% | |
---|---|---|---|---|---|
Liberal Democrats | Dave Poulton | 1,419 | 56.4 | –11.3 | |
Conservative | Verina Weaver | 762 | 30.3 | +6.6 | |
Labour | Christopher Clarke | 193 | 7.7 | +2.7 | |
Green | Lauren Ekins | 78 | 3.1 | +1.1 | |
Confelicity | Simon Spooner | 53 | 2.1 | +0.6 | |
Majority | 657 | 26.1 | –17.9 | ||
Turnout | 2,517 | 34.5 | –1.4 | ||
Liberal Democrats gain from Conservative | Swing | 9.0 | |||
Party | Candidate | Votes | % | ±% | |
---|---|---|---|---|---|
Labour | Irene Ferguson | 846 | 51.0 | –3.9 | |
Conservative | Marco Mann | 237 | 14.3 | –7.2 | |
Independent | Kay Mitchell | 179 | 10.8 | N/A | |
Confelicity | Lee Clark | 155 | 9.3 | +3.7 | |
Green | Thomas Love | 128 | 7.7 | –0.6 | |
Liberal Democrats | Alan Crystall | 58 | 3.5 | –1.5 | |
Heritage | Lara Hurley | 51 | 3.1 | +0.9 | |
Majority | 609 | 36.7 | +3.3 | ||
Turnout | 1,660 | 20.8 | +0.3 | ||
Labour gain from Independent | Swing | 1.7 | |||
Party | Candidate | Votes | % | ±% | |
---|---|---|---|---|---|
Green | Stuart Allen | 1,725 | 57.6 | +18.5 | |
Liberal Democrats | Jean de Tourtoulon | 637 | 21.3 | –10.1 | |
Conservative | Mary Canet-Espi | 342 | 11.4 | –7.4 | |
Labour | Malla Reddy Gurram | 202 | 6.7 | –1.9 | |
Confelicity | James Miller | 80 | 2.7 | +1.3 | |
Majority | 1,088 | 36.3 | +28.6 | ||
Turnout | 2,996 | 40.9 | +4.7 | ||
Green gain from Liberal Democrats | Swing | 14.3 | |||
Party | Candidate | Votes | % | ±% | |
---|---|---|---|---|---|
Labour | Sam Allen | 1,170 | 52.1 | +1.0 | |
Conservative | Jonathan Garston | 540 | 24.0 | –0.2 | |
Green | Sarah-Ann Patel | 269 | 12.0 | +2.0 | |
Heritage | Bianca Isherwood | 106 | 4.7 | ±0.0 | |
Liberal Democrats | Robert Howes | 84 | 3.7 | –2.7 | |
Confelicity | Dee Curtis | 68 | 3.0 | –0.7 | |
Majority | 630 | 28.1 | +1.2 | ||
Turnout | 2,246 | 27.0 | –0.6 | ||
Labour hold | Swing | 0.6 | |||
Party | Candidate | Votes | % | ±% | |
---|---|---|---|---|---|
Conservative | David Garston* | 1,032 | 39.0 | –4.6 | |
Labour | Chris Webster | 971 | 36.7 | –0.8 | |
Green | RJ Learmouth | 220 | 8.3 | +2.8 | |
Independent | Leanne Kelly | 170 | 6.4 | N/A | |
Liberal Democrats | Pierre Craddock | 142 | 5.4 | –4.0 | |
Confelicity | Simon Jones | 87 | 3.3 | –0.7 | |
Majority | 61 | 2.3 | –3.8 | ||
Turnout | 2,645 | 33.8 | –0.5 | ||
Conservative hold | Swing | 1.9 | |||
Party | Candidate | Votes | % | ±% | |
---|---|---|---|---|---|
Conservative | Judith McMahon | 742 | 31.5 | –3.6 | |
Labour | Kevin Ryan | 734 | 31.1 | +14.6 | |
Independent | Tricia Cowdrey | 628 | 26.6 | –12.1 | |
Green | Fiona Clapperton | 125 | 5.3 | +0.1 | |
Liberal Democrats | Chris Bailey | 68 | 2.9 | +0.4 | |
Confelicity | Kayleigh Burgess | 47 | 2.0 | ±0.0 | |
Majority | 8 | 0.4 | N/A | ||
Turnout | 2,357 | 27.6 | +0.9 | ||
Conservative hold | Swing | 9.1 | |||
Party | Candidate | Votes | % | ±% | |
---|---|---|---|---|---|
Conservative | Darryl Jones* | 1,317 | 52.2 | +0.4 | |
Labour | Carrie Druce | 560 | 27.7 | +11.6 | |
Green | Matthew Dallat | 162 | 7.4 | +0.4 | |
Confelicity | Dean Harris-Eckett | 151 | 6.9 | +2.7 | |
Liberal Democrats | Billy Boulton | 102 | 4.7 | +0.6 | |
Heritage | Angela Mozzato | 47 | 2.2 | N/A | |
Majority | 757 | 24.5 | –10.5 | ||
Turnout | 2,178 | 29.5 | –0.3 | ||
Conservative hold | Swing | 5.6 | |||
Party | Candidate | Votes | % | ±% | |
---|---|---|---|---|---|
Labour | Madison Faulkner-Hatt | 1,164 | 50.0 | –3.6 | |
Conservative | Samuel Pettengell | 790 | 33.9 | –1.7 | |
Liberal Democrats | Kev Malone | 148 | 6.4 | +1.3 | |
Green | Simon Gittus | 120 | 5.2 | +1.6 | |
Confelicity | Sandy van Deventer | 93 | 4.0 | +1.8 | |
Majority | 374 | 16.1 | –1.9 | ||
Turnout | 2,327 | 29.6 | –1.3 | ||
Labour gain from Conservative | Swing | 1.0 | |||
Party | Candidate | Votes | % | ±% | |
---|---|---|---|---|---|
Labour | Jane Norman | 911 | 43.8 | –5.0 | |
Conservative | Brian Beggs* | 534 | 25.7 | +3.8 | |
Independent | Brian Ayling | 212 | 10.2 | –1.3 | |
Green | Tilly Hogrebe | 191 | 9.2 | +0.3 | |
Confelicity | Joleen Hills | 84 | 4.0 | –1.1 | |
Liberal Democrats | Sara-Jayne Boulton | 69 | 3.3 | –0.6 | |
Heritage | Adam Ball | 61 | 2.9 | N/A | |
Majority | 377 | 18.1 | –8.7 | ||
Turnout | 2,081 | 26.0 | +0.9 | ||
Labour gain from Conservative | Swing | 4.4 | |||
Party | Candidate | Votes | % | ±% | |
---|---|---|---|---|---|
Independent | Susan Badger | 1,001 | 35.8 | –0.4 | |
Conservative | Gavin Chambers | 870 | 31.1 | +2.8 | |
Labour | David Scott | 571 | 20.4 | +8.1 | |
Green | Julie Callow | 166 | 5.9 | +0.9 | |
Confelicity | Melissa Aylott | 69 | 2.5 | +0.6 | |
Liberal Democrats | Katie Kurilecz | 54 | 1.9 | –0.1 | |
Heritage | Adam Isherwood | 51 | 1.8 | N/A | |
Majority | 131 | 4.7 | –3.2 | ||
Turnout | 2,797 | 38.8 | –2.3 | ||
Independent hold | Swing | 1.6 | |||
Party | Candidate | Votes | % | ±% | |
---|---|---|---|---|---|
Labour | Ian Gilbert* | 1,109 | 60.1 | +0.5 | |
Conservative | Bernard Arscott | 298 | 16.2 | –3.3 | |
Green | Peter Walker | 180 | 9.8 | ±0.0 | |
Liberal Democrats | Philip Edey | 100 | 5.4 | –1.1 | |
Heritage | Sandra Wiseman | 76 | 4.1 | N/A | |
Confelicity | Jonathan Humphreys | 61 | 3.3 | –1.4 | |
Majority | 811 | 43.9 | +3.8 | ||
Turnout | 1,844 | 20.1 | +0.3 | ||
Labour hold | Swing | 1.9 | |||
Party | Candidate | Votes | % | ±% | |
---|---|---|---|---|---|
Conservative | Lesley Salter | 1,086 | 37.9 | –9.2 | |
Liberal Democrats | Peter Wexham | 895 | 30.7 | –3.8 | |
Green | Gemma Deeney | 413 | 14.2 | +5.9 | |
Labour | James Morrison | 407 | 14.0 | +6.2 | |
Confelicity | Jane Wilkes | 96 | 3.3 | +1.0 | |
Majority | 191 | 7.2 | –5.4 | ||
Turnout | 2,912 | 40.8 | +1.6 | ||
Conservative hold | Swing | 2.7 | |||
Party | Candidate | Votes | % | ±% | |
---|---|---|---|---|---|
Conservative | James Moyies* | 1,002 | 45.3 | –13.1 | |
Labour Co-op | Ian Pope | 524 | 23.7 | +3.0 | |
Independent | Barry Godwin | 402 | 18.2 | N/A | |
Green | Lea Williams | 147 | 6.6 | –2.0 | |
Liberal Democrats | Granville Stride | 70 | 3.2 | –4.3 | |
Confelicity | Robert Cammidge | 58 | 2.6 | –2.3 | |
Majority | 478 | 21.6 | –16.0 | ||
Turnout | 2,214 | 30.2 | +0.4 | ||
Conservative hold | Swing | 8.1 | |||
Party | Candidate | Votes | % | ±% | |
---|---|---|---|---|---|
Labour | Pamela Kinsella | 1,063 | 53.8 | –3.1 | |
Conservative | Dr Vel | 375 | 19.0 | +0.5 | |
Green | Stephen Jordan | 263 | 13.3 | +1.4 | |
Liberal Democrats | Suzanna Edey | 186 | 9.4 | +0.8 | |
Confelicity | Noah Hughes | 74 | 3.7 | –0.4 | |
Majority | 688 | 34.8 | –3.6 | ||
Turnout | 1,977 | 25.8 | +1.8 | ||
Labour hold | Swing | 1.8 | |||
Aberdeen City Council is the local government authority for the city of Aberdeen, Scotland. It was created in 1996, under the Local Government etc. (Scotland) Act 1994, though a sense of Aberdeen as a city, with its own city council, can be traced back to 1900, when the county of the city of Aberdeen was created.
This article documents the strengths of political parties in the 317 local authorities of England, 32 local authorities of Scotland, 22 principal councils of Wales and 11 local councils of Northern Ireland.
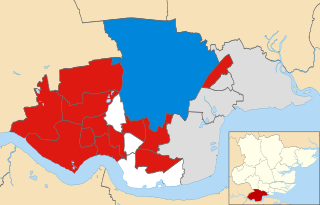
The 2000 Southend-on-Sea Council election took place on 4 May 2000 to elect members of Southend-on-Sea Unitary Council in Essex, England. One third of the council was up for election and the Conservative party gained overall control of the council from no overall control.
The 2006 Southend-on-Sea Council election took place on 4 May 2006 to elect members of Southend-on-Sea Unitary Council in Essex, England. One third of the council was up for election and the Conservative party stayed in overall control of the council.
The 2007 Southend-on-Sea Council election took place on 3 May 2007 to elect members of Southend-on-Sea Unitary Council in Essex, England. One third of the council was up for election and the Conservative party stayed in overall control of the council.
The 2011 North Somerset Council election took place on 5 May 2011 to elect members of North Somerset Unitary Council in Somerset, England. The whole council was up for election and the Conservative Party stayed in overall control of the council.
The 2011 Carlisle City Council election took place on 5 May 2011 to elect members of Carlisle District Council in Cumbria, England. One third of the council was up for election and the council stayed under no overall control.
Southend-on-Sea City Council is the local authority of the Southend-on-Sea district in Essex, England. It is a unitary authority, having the powers of a non-metropolitan county and district council combined. It is a member of the East of England Local Government Association. It is based at Southend Civic Centre in Southend-on-Sea.
The 2012 Carlisle City Council election took place on 3 May 2012 to elect members of Carlisle District Council in Cumbria, England. One third of the council was up for election and the Labour Party gained overall control of the council from no overall control.
The 2018 Plymouth City Council election took place on 3 May 2018 to elect members of Plymouth City Council in England. The election was won by the Labour Party, who gained enough seats to achieve an overall majority and took control of the council.
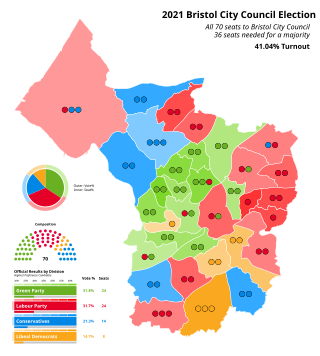
The 2021 Bristol City Council election took place on 6 May 2021 to elect members of Bristol City Council in England. It coincided with nationwide local elections. Voters in the city also voted for the mayor of Bristol, the mayor of the West of England and for Avon and Somerset's police and crime commissioner. The election was originally due to take place in May 2020, but was postponed due to the COVID-19 pandemic.
The 2022 Bromley London Borough Council election took place on 5 May 2022. All 58 members of Bromley London Borough Council were elected. The elections took place alongside local elections in the other London boroughs and elections to local authorities across the United Kingdom.
Elections to the City of Edinburgh Council took place on 5 May 2022 on the same day as the 31 other Scottish local government elections. As with other Scottish council elections, it was held using single transferable vote (STV) – a form of proportional representation – in which multiple candidates are elected in each ward and voters rank candidates in order of preference.
The 2023 Guildford Borough Council election was held on 4 May 2023, to elect all 48 seats to the Guildford Borough Council in Surrey, England as part of the 2023 local elections. The results saw the Liberal Democrat take overall control of Guildford Borough Council.
Elections to Angus Council took place on 5 May 2022, the same day as the 31 other Scottish local government elections. As with other Scottish council elections, it was held using single transferable vote (STV) – a form of proportional representation – in which multiple candidates are elected in each ward and voters rank candidates in order of preference.
Elections to Argyll and Bute Council took place on 5 May 2022, the same day as the 31 other Scottish local government elections. As with other Scottish council elections, it was held using single transferable vote (STV)—a form of proportional representation—in which multiple candidates are elected in each ward and voters rank candidates in order of preference. New ward boundaries were proposed by Boundaries Scotland in 2021, which would have reduced the total number of councillors to 34. However, these were rejected by the Scottish Parliament and the boundaries used at the previous election remained in place.
The 2023 Southend-on-Sea City Council election was held on 4 May 2023 to elect members of Southend-on-Sea City Council in England. It coincided with local elections across the United Kingdom.
The 2024 Thurrock Council election was held on 2 May 2024 to elect a third of the members of Thurrock Council in Essex, England. It was held on the same day as other local elections across England, including the 2024 Essex police and crime commissioner election. The Labour Party led by John Kent won control of the council for the first time since 2014 from the Conservative Party, which had previously governed in a minority administration with no overall control.
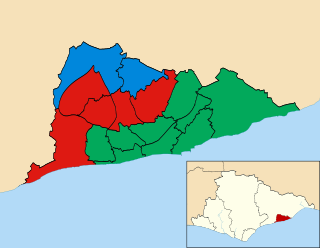
The 2024 Hastings Borough Council election is scheduled to be held on Thursday 2 May 2024, alongside the other local elections in the United Kingdom being held on the same day. One-half of the 32 members of Hastings Borough Council in East Sussex will be elected.