2018 Southend-on-Sea Borough Council election

Last updated

2018 Southend-on-Sea Borough Council
Flag of Essex.svg
  2016 3 May 2018 (2018-05-03) 2019  

17 out of 51 seats to Southend-on-Sea Borough Council
26 seats needed for a majority
Turnout32.2%
 First partySecond partyThird party
  John Lamb (cropped).jpg Ian Gilbert (cropped).jpg
Ind
LeaderJohn LambIan Gilbertn/a
Party Conservative Labour Independent
Leader since25 May 2014Oct/Nov 2010n/a
Leader's seatWest LeighVictorian/a
Last election24 seats, 30.6%10 seats, 19.0%13 seats, 21.0%
Seats before28912
Seats won853
Seats after29119
Seat changeIncrease2.svg 5Increase2.svg 1Decrease2.svg 4
Popular vote15,65811,4128,269
Percentage37.0%27.0%19.5%
SwingIncrease2.svg 6.4%Increase2.svg 8.0%Decrease2.svg 1.5%

 Fourth party
  Carole Mulroney (cropped).jpg
LeaderCarole Mulroney
Party Liberal Democrats
Leader sinceMay 2017
Leader's seat Leigh
Last election2 seats, %
Seats before2
Seats won1
Seats after2
Seat changeSteady2.svg
Popular vote5,357
Percentage12.7%
SwingIncrease2.svg 2.3%

Southend UK local election 2018 map.svg
Map showing the results of the 2018 Southend-on-Sea Borough Council election

Southend 2018.svg

Leader before election

John Lamb
Conservative

Leader after election

John Lamb
Conservative

Elections to Southend-on-Sea Borough Council took place on 3 May 2018. This was on the same day as other local elections across the United Kingdom.

Contents

Composition

Directly after the 2016 election the composition of the council was:

13102224
IndLabourLib DemUKIPConservative

Prior to the election the composition of the council was:

129228
IndLabourLib DemConservative

After the election, the composition of the council was:

119229
LabourIndLib DemConservative

Result Summary

Southend-on-Sea Borough Council election, 2018
PartySeatsGainsLossesNet gain/lossSeats %Votes %Votes+/−
  Conservative 2921Increase2.svg 137.015,658Increase2.svg6.4
  Labour 1120Increase2.svg 227.011,412Increase2.svg8.0
  Independent 903Decrease2.svg 319.58,269Decrease2.svg1.5
  Liberal Democrats 200Steady2.svg12.75,357Increase2.svg2.3
  Green 000Steady2.svg2.81,184Decrease2.svg1.5
  UKIP 000Steady2.svg0.9390Decrease2.svg13.8
 Psychedelic Future000Steady2.svg0.042New

Ward results

Belfairs

Belfairs
PartyCandidateVotes%±%
Conservative Alan Dear 1,329 50.4 Increase2.svg11.2
Independent Stephen McKiernan44516.3New
Labour Taylor Barral42316.0Increase2.svg5.5
Liberal Democrats Sarah Risbin1636.2Increase2.svg2.2
UKIP Frank Snell1555.9New
Green Nick Brown1214.6Increase2.svg0.6
Majority88434.1
Turnout 2,19135.2
Conservative hold Swing

No Independent candidate as previous (−41.6).

Blenheim Park

Blenheim Park
PartyCandidateVotes%±%
Labour Laurie Burton 906 35.1 Increase2.svg10.5
Conservative Floyd Waterworth83532.4Increase2.svg0.8
Independent Keith Evans52720.4Increase2.svg15.7
Liberal Democrats Michael Grimwade2047.9Decrease2.svg6.1
UKIP Paul Lloyd1064.1Decrease2.svg17.9
Majority712.8
Turnout 2,57831.9
Labour gain from Conservative Swing Decrease2.svg

No Green candidate as previous (−4.2).

Chalkwell

Chalkwell
PartyCandidateVotes%±%
Conservative Nigel Folkard 981 40.8 Increase2.svg2.3
Independent Andy Crow61625.6Increase2.svg1.9
Labour Sean Jones53522.3Increase2.svg6.0
Liberal Democrats Jill Allen-King27211.3Increase2.svg6.0
Majority36515.2
Turnout 2,40432.7
Conservative hold Swing Increase2.svg0.2

No UKIP (−10.5) or Green (−5.8) candidates as previous.

Eastwood Park

Eastwood Park
PartyCandidateVotes%±%
Conservative Andrew Moring 1,324 54.8 Increase2.svg12.3
Liberal Democrats Paul Collins78032.3Increase2.svg13.0
Labour Ros Sanders31112.9Increase2.svg3.7
Majority54422.5
Turnout 2,41532.2
Conservative hold Swing Decrease2.svg

No UKIP (−26.8) or Green (−2.1) candidates as previous.

Kursaal

Kursaal
PartyCandidateVotes%±%
Labour Matt Dent 1,008 51.9 Increase2.svg9.8
Conservative Dave Clift47924.7Increase2.svg2.2
Liberal Democrats Howard Gibeon45623.5Increase2.svg19.0
Majority52927.2
Turnout 1,94324.4
Labour gain from Independent Swing Decrease2.svg

No UKIP (−19.0) or Green (−8.4) candidates as previous.

Leigh

Leigh
PartyCandidateVotes%±%
Liberal Democrats Carole Mulroney 1,077 39.6 Decrease2.svg9.5
Conservative Paul Gilson87932.4Increase2.svg8.6
Labour Michelle Williams58621.6Increase2.svg10.3
Green Jon Mullett1756.4Decrease2.svg0.8
Majority1987.3
Turnout 2,71735.8
Liberal Democrats hold Swing Decrease2.svg

No UKIP candidate as previous (−8.5).

Milton

Milton
PartyCandidateVotes%±%
Labour Cheryl Nevin 1,305 50.7 Increase2.svg5.4
Conservative Garry Lowen83232.2Increase2.svg5.9
Independent Stephen Cummins1776.9Increase2.svg1.4
Green Vida Guilford1465.7Decrease2.svg0.6
Liberal Democrats Bob Howes1164.5Increase2.svg1.0
Majority47318.4
Turnout 2,57631.5
Labour hold Swing Decrease2.svg

No UKIP candidate as previous (−13.2).

Prittlewell

Prittlewell
PartyCandidateVotes%±%
Conservative Kevin Buck 1,051 40.3 Increase2.svg10.2
Labour Jennifer Beck79430.5Increase2.svg3.5
Independent Tino Callaghan*43516.7New
Liberal Democrats Adam Hutchins1937.4Decrease2.svg2.7
Green Simon Cross1345.1Increase2.svg0.4
Majority2579.9
Turnout 2,60733.4
Conservative gain from Independent Swing Decrease2.svg

No UKIP (−18.8) or Independent (−9.3) candidates as previous.

Shoeburyness

Shoeburyness
PartyCandidateVotes%±%
Independent Nick Ward 1,332 49.1 Increase2.svg4.9
Conservative Val Jarvis84731.2Increase2.svg6.9
Labour Greg Keane47717.6Increase2.svg8.2
Liberal Democrats Granville Stride552.0Steady2.svg
Majority48517.9
Turnout 2,71128.5
Independent hold Swing Decrease2.svg

No UKIP (−12.3), Green (−2.3) or two Independent candidates (−29.0, −21.0) as previous.

Independent vote share change compared to 2014 election.

Southchurch

Southchurch
PartyCandidateVotes%±%
Conservative Daniel Nelson 1,210 47.5 Increase2.svg12.4
Independent Derek Kenyon69627.3Decrease2.svg16.9
Labour Martin Berry47618.7Increase2.svg6.6
Green Jules Esposito1024.0Increase2.svg0.7
Liberal Democrats John Batch642.5Increase2.svg0.4
Majority51420.2
Turnout 2,54833.3
Conservative gain from Independent Swing Decrease2.svg

No Independent (−32.6) or UKIP (−14.9) candidates as previous.

St. Laurence

St. Laurence
PartyCandidateVotes%±%
Conservative David McGlone 855 34.4 Decrease2.svg3.8
Independent David Allen77931.3New
Labour Janet Phillips43817.6Increase2.svg0.5
Liberal Democrats Kev Malone41616.7Increase2.svg6.6
Majority763.1
Turnout 2,48831.8
Conservative hold Swing Decrease2.svg

No UKIP (−20.3) or Green (−3.0) candidates as previous.

St. Luke's

St. Luke's
PartyCandidateVotes%±%
Independent Trevor Harp 850 37.4 Increase2.svg0.4
Labour Ian Pope73032.1Increase2.svg11.2
Conservative Harry Mason49221.7Increase2.svg1.2
Green James Thomas873.8Decrease2.svg0.8
Liberal Democrats Christopher Arnold703.1Increase2.svg1.7
Psychedelic Future Jason Pilley421.8New
Majority120
Turnout 27.7Decrease2.svg
Independent hold Swing Decrease2.svg5.4

No UKIP (−15.6) candidates as previous.

Thorpe

Thorpe
PartyCandidateVotes%±%
Independent Martin Terry 1,871 58.6 Decrease2.svg11.0
Conservative James Moyies93529.3Increase2.svg13.3
Labour Jack Reason3059.6Increase2.svg3.4
Liberal Democrats James Clinkscales802.5Increase2.svg0.6
Majority93629.3
Turnout 3,19142.7
Independent hold Swing Decrease2.svg

No Independent (−63.1), UKIP (−10.0) or Green (−2.8) candidates as previous.

Independent vote share change compared to 2014 election.

Victoria

Victoria
PartyCandidateVotes%±%
Labour Margaret Borton 1,222 61.0 Increase2.svg6.3
Conservative John Harland49224.6Increase2.svg9.3
Green Clare Fletcher28814.4Increase2.svg7.9
Majority73036.5
Turnout 2,00225.3
Labour hold Swing Decrease2.svg1.5

No UKIP (−19.8) or Liberal Democrat (−3.7) candidates as previous.

West Leigh

West Leigh
PartyCandidateVotes%±%
Conservative Fay Evans 1,489 48.9 Increase2.svg4.3
Liberal Democrats Ashley Thompson1,04134.2Increase2.svg6.1
Labour Hilary Scarnell36715.0Increase2.svg6.4
UKIP Lesley Martin1294.2Decrease2.svg7.2
Majority44814.7
Turnout 3,04242.8
Conservative hold Swing Decrease2.svg1.1

No Independent (−4.0) or Green (−3.3) candidates as previous.

West Shoebury

West Shoebury
PartyCandidateVotes%±%
Conservative Denis Garne 1,089 44.6 Increase2.svg8.6
Independent Peter Lovett79232.4Decrease2.svg1.7
Labour Tom Murray36715.0Increase2.svg4.8
Liberal Democrats David Barrett1958.0Increase2.svg5.6
Majority29712.2
Turnout 3,04232.7
Conservative hold Swing Decrease2.svg

No UKIP (−15.3) or Green (−2.0) candidates as previous.

Westborough

Westborough
PartyCandidateVotes%±%
Labour Kevin Robinson 1,146 52.4 Increase2.svg18.5
Conservative Jack Warren53924.7Increase2.svg10.2
Independent Alan Hart1948.9Increase2.svg5.1
Liberal Democrats Billy Boulton1758.0Increase2.svg2.2
Green Paul Mansfield1316.0Decrease2.svg0.1
Majority60727.8
Turnout 2,18528.5
Labour hold Swing Increase2.svg4.2

No Independent (−22.1) or UKIP (−12.9) candidates as previous.

Related Research Articles

<span class="mw-page-title-main">Boston and Skegness (UK Parliament constituency)</span> Parliamentary constituency in the United Kingdom

Boston and Skegness is a county constituency, represented in the House of Commons of the UK Parliament. It is located in Lincolnshire, England. Like all British constituencies, Boston and Skegness elects one Member of Parliament (MP) by the first-past-the-post system of election. The seat has been represented by the Conservative MP Matt Warman since the 2015 general election, and is usually considered a safe seat for the party.

<span class="mw-page-title-main">Rochford and Southend East (UK Parliament constituency)</span> Parliamentary constituency in the United Kingdom, 1997 onwards

Rochford and Southend East is a constituency represented in the House of Commons of the UK Parliament since 2005 by Sir James Duddridge, a Conservative.

<span class="mw-page-title-main">Southend West (UK Parliament constituency)</span> Parliamentary constituency in the United Kingdom, 1950 onwards

Southend West is a constituency in the House of Commons of the UK Parliament. The seat is currently held by Anna Firth who won the 2022 by-election, following the murder of the incumbent MP, David Amess.

Essex County Council in England is elected every four years. Since the last boundary changes in 2005, 75 councillors are elected from 70 wards.

<span class="mw-page-title-main">2013 Norfolk County Council election</span>

The Norfolk County Council election took place across Norfolk on 2 May 2013, coinciding with local elections for all county councils in England. The results were announced the following day, Friday 3 May 2013. The result brought to an end 12 years of Conservative administration, who finished three seats short of a majority after losing 20 seats, leaving the Council in no overall control (NOC). UKIP and the Labour Party both made gains of 14 and 11 seats respectively. The Liberal Democrats and the Green Party both lost three seats each, whilst an independent won a single seat in North Norfolk.

<span class="mw-page-title-main">2013 Essex County Council election</span>

An election to Essex County Council took place on 2 May 2013 as part of the 2013 United Kingdom local elections. 75 councillors were elected from 70 electoral divisions, which returned either one or two county councillors each by first-past-the-post voting for a four-year term of office. The electoral divisions were the same as those used at the previous election in 2009. No elections were held in Thurrock or Southend-on-Sea, which are unitary authorities outside the area covered by the County Council.

<span class="mw-page-title-main">2016 Colchester Borough Council election</span>

Elections to Colchester Borough Council took place on 5 May 2016. Colchester Borough Council normally elects one third of its councillors each year, however, due to boundary changes, the whole council is up for election.

<span class="mw-page-title-main">2016 Cannock Chase District Council election</span>

Elections to Cannock Chase District Council took place on 5 May 2016. This election was held on the same day as other local elections as well as Police and Crime Commissioner elections. A total of 13 councillors were elected from all but two of the council's wards as a third of the council was up for election.

<span class="mw-page-title-main">2017 Essex County Council election</span>

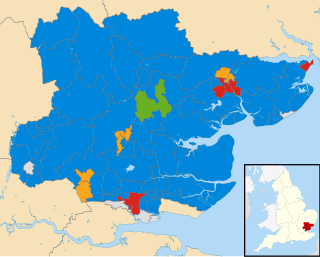
Elections to Essex County Council took place on 4 May 2017 as part of the 2017 local elections. All 75 councillors were elected from 70 electoral divisions, which each returned either one or two councillors by first-past-the-post voting for a four-year term of office.

<span class="mw-page-title-main">2017 Hampshire County Council election</span>

The 2017 Hampshire County Council election took place on 4 May 2017 as part of the 2017 local elections in the United Kingdom. All councillors were elected from electoral divisions by first-past-the-post voting for a four-year term of office. The electoral divisions were somewhat changed from the previous election, with some being split, merged or with boundary changes. No elections were held in Portsmouth and Southampton, which are unitary authorities and hold their elections in other years. Similarly the districts within Hampshire did also not hold elections this year.

<span class="mw-page-title-main">2018 Thurrock Council election</span>

The 2018 Thurrock Council elections took place on 3 May 2018 to elect members of Thurrock Council in England. Councillors in 16 out of the 20 electoral wards were to be up for election. The council remained under no overall control, with a minority Conservative administration running the council.

<span class="mw-page-title-main">2018 Plymouth City Council election</span> 2018 local election in Plymouth

The 2018 Plymouth City Council election took place on 3 May 2018 to elect members of Plymouth City Council in England. The election was won by the Labour Party, who gained enough seats to achieve an overall majority and took control of the council.

<span class="mw-page-title-main">2018 Hammersmith and Fulham London Borough Council election</span> 2018 local election in England

The 2018 Hammersmith and Fulham Council election took place on 3 May 2018 to elect members of Hammersmith and Fulham Council in London.

<span class="mw-page-title-main">2018 Calderdale Metropolitan Borough Council election</span>

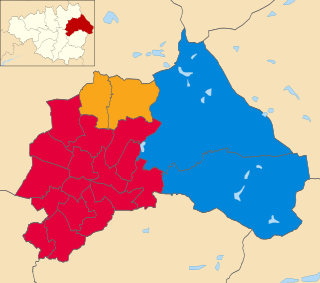
The 2018 Calderdale Metropolitan Borough Council election took place on 3 May 2018 to elect members of Calderdale Metropolitan Borough Council in England. This was on the same day as other local elections. One councillor was elected in each ward for a four-year term so the councillors elected in 2018 last stood for election in 2014. Each ward is represented by three councillors, the election of which is staggered, so only one third of the councillors were elected in this election. Before the election there was no overall control with a minority Labour administration. Following the election Labour, having gained one councillor, was still two councillors away from a majority so it remained no overall control.

<span class="mw-page-title-main">2018 Cannock Chase District Council election</span>

Elections to Cannock Chase District Council took place on 3 May 2018 on the same day as other local elections in England. A third of the council was up for election, meaning a total of 13 councillors were elected from all but two of the council's wards.

<span class="mw-page-title-main">2018 City of Bradford Metropolitan District Council election</span>

The 2018 City of Bradford Metropolitan District Council took place on 3 May 2018 to elect members of Bradford District Council in England. This was on the same day as other local elections. One councillor was elected in each ward for a four-year term so the councillors elected in 2018 last stood for election in 2014. Each ward is represented by three councillors, the election of which is staggered, so only one third of the councillors were elected in this election. Before the election there was a Labour majority and afterwards Labour had increased their majority.

<span class="mw-page-title-main">2018 Oldham Metropolitan Borough Council election</span>

The 2018 Oldham Council election took place on 3 May 2018 to elect members of Oldham Council in England. The election took place on the same day as other local elections in England. The election saw the majority Labour Party increase its number of seats by two. The Conservative Party also gained two seats, while the Liberal Democrats lost one seat. UKIP ceased to have representation on the council following this election. The election left Labour with 47 seats, the Liberal Democrats 8 and the Conservatives 4 with the remaining seat being held by an Independent.

<span class="mw-page-title-main">2019 Cannock Chase District Council election</span>

Elections to Cannock Chase District Council took place on 2 May 2019 on the same day as other local elections in England, including to several parish councils in the district. All of the council's wards were up for election, meaning a total of 15 councillors were elected.

<span class="mw-page-title-main">2019 Southend-on-Sea Borough Council election</span>

Elections to Southend-on-Sea Borough Council took place on 2 May 2019. This was on the same day as other local elections across the United Kingdom.

<span class="mw-page-title-main">2021 Southend-on-Sea Borough Council election</span>

Elections to Southend-on-Sea Borough Council took place on 6 May 2021. This was on the same day as other local elections across the United Kingdom. The results saw the Conservatives and Labour pick up seats at the expense of the local Independents.

References