2016 Southend-on-Sea Borough Council election

Last updated

2016 Southend-on-Sea Borough Council
Flag of Essex.svg
  2015 5 May 2016 (2016-05-05) 2018  

17 out of 51 seats to Southend-on-Sea Borough Council
26 seats needed for a majority
Turnout30.9%
 First partySecond partyThird party
  John Lamb (cropped).jpg
Ind
Ian Gilbert (cropped).jpg
LeaderJohn Lambn/aIan Gilbert
Party Conservative Independent Labour
Leader since25 May 2014n/aOct/Nov 2010
Leader's seatWest Leighn/aVictoria
Last election22 seats, 39.3%11 seats, 14.3%9 seats, 19.2%
Seats before22149
Seats won844
Seats after241310
Seat changeIncrease2.svg 2Increase2.svg 2Increase2.svg 1
Popular vote11,3837,7967,080
Percentage30.6%21.0%19.0%
SwingDecrease2.svg 9.1%Increase2.svg 6.6%Decrease2.svg 0.1%

 Fourth partyFifth party
  Floyd Waterworth (cropped).jpg Graham Longley (cropped).jpg
LeaderFloyd WaterworthGraham Longley
Party UKIP Liberal Democrats
Leader sinceMay 2015
Leader's seat Blenheim Park Blenheim Park (retired)
Last election5 seats, 10.2%4 seats, 10.0%
Seats before24
Seats won01
Seats after22
Seat changeDecrease2.svg 3Decrease2.svg 2
Popular vote5,4723,883
Percentage14.7%10.4%
SwingIncrease2.svg 3.7%Increase2.svg 0.4%

Southend-on-Sea Borough Council election 2016 results.svg

Leader before election

Ron Woodley
Independent
No overall control

Leader after election

John Lamb
Conservative
No overall control

The 2016 Southend-on-Sea Borough Council election took place on 5 May 2016 to elect members of Southend-on-Sea Borough Council. [1] This was on the same day as other local elections. [2]

Contents

Result Summary

Prior to the election, three UKIP councillors left the UKIP group to sit as the Southend Independence Group. They are shown in the table as Independents.

2016 Southend-on-Sea Borough Council election
PartyThis electionFull councilThis election
SeatsNetSeats %OtherTotalTotal %VotesVotes %+/−
  Conservative 8Increase2.svg 247.1162449.011,38330.6–9.1
  Independent 4Decrease2.svg 123.591321.67,79621.0+6.6
  Labour 4Increase2.svg 123.561021.67,08019.0–0.1
  Liberal Democrats 1Decrease2.svg 25.9123.93,88310.4+0.7
  UKIP 0Steady2.svg0.0223.95,47214.7+3.7
  Green 0Steady2.svg0.0000.01,5984.3–3.0

Ward results

Belfairs

Belfairs
PartyCandidateVotes%±%
Independent Stephen Aylen 1,051 41.6 +9.1†
Conservative Alan Dear99039.2-3.4
Labour Dave Alston26410.5-1.9
Green Nick Brown1174.6-0.5
Liberal Democrats Richard Herbert1024.0-3.9
Majority
Turnout 34.16
Independent hold Swing

† percentage change is compared to the 2012 election

Blenheim Park

Blenheim Park
PartyCandidateVotes%±%
Conservative Helen Boyd 715 31.6 -6.2
Labour Matt Dent55524.6+6.0
UKIP Roger Weaver47421.0-1.4
Liberal Democrats Jill Allen-King31714.0-0.3
Independent Colin Ritchie1054.7N/A
Green Jules Esposito944.2-3.4
Majority1607.1
Turnout 2,26029.0
Conservative gain from Liberal Democrats Swing

Chalkwell

Chalkwell
PartyCandidateVotes%±%
Conservative David Burzotta 817 38.5 -10.9
Independent Andy Crow50223.6N/A
Labour Taylor Barrall34716.3-3.2
UKIP Paul Lloyd22310.5N/A
Green Mark Meatcher1245.8-2.5
Liberal Democrats Colin Davis1125.3-1.3
Majority
Turnout 30.13
Conservative hold Swing

Eastwood Park

Eastwood Park
PartyCandidateVotes%±%
Conservative Chris Walker 1,022 42.5 -15.4
UKIP Verina Weaver64426.8N/A
Liberal Democrats Paul Collins46419.30.0
Labour Sean Jones2229.2-5.6
Green Fiddian Warman502.1-6.0
Majority32.46
Turnout 32.46
Conservative hold Swing

Kursaal

Kursaal
PartyCandidateVotes%±%
Labour Helen McDonald 709 42.1 +5.6
UKIP Gordon Bailey-Smith37922.5-1.5
Conservative Simon Gittus37822.5-2.9
Green Liz Swanson1418.4-1.2
Liberal Democrats Richard Collins754.5-0.1
Majority33019.6
Turnout 1,68221.73
Labour hold Swing

Leigh

Leigh
PartyCandidateVotes%±%
Liberal Democrats Peter Wexham 1,185 49.1 +17.1
Conservative John Hodge57423.8-17.7
Labour Matt Zarb-Cousin27211.3-3.7
UKIP Ted Preedy2068.5N/A
Green Jon Mullett1747.2-4.3
Majority
Turnout 32.62
Liberal Democrats hold Swing

Milton

Milton
PartyCandidateVotes%±%
Labour Julian Ware-Lane 1,020 45.3 +7.5
Conservative Daniel Nelson59326.3-12.7
UKIP Jo Googe29713.2N/A
Green Stephen Bartram1426.3-4.6
Independent Stephen Cummins1245.5-1.2
Liberal Democrats Robert Howes783.5+2.1
Majority
Turnout 30.47
Labour hold Swing

Prittlewell

Prittlewell
PartyCandidateVotes%±%
Conservative David Garston 758 30.1 -16.2
Labour Mike Fieldhouse68027.0+7.6
UKIP Bob Gage47318.8N/A
Liberal Democrats Mary Betson25310.1-0.7
Independent Paul Ryder2339.3-5.4
Green Abbie-Jade Sutherland1184.7-4.1
Majority
Turnout 32.82
Conservative gain from Liberal Democrats Swing

Shoeburyness

Shoeburyness
PartyCandidateVotes%±%
Independent Mike Assenheim 728 29.0 -22.7†
Conservative Sue Abrahams60724.1-14.7
Independent Anne Chalk52721.0-13.8
UKIP Edward McNally30912.3N/A
Labour Maggie Kelly2369.4-8.7
Green Nigel Outten572.3-3.3
Liberal Democrats David Barrett502.0-0.7
Majority
Turnout 29.47
Independent hold Swing

† percentage change compared to 2012 election.

Southchurch

Southchurch
PartyCandidateVotes%±%
Conservative Alex Bright 861 35.1 -3.5
Independent Keith Sharman80032.6+10.6
UKIP Barrie Page36714.9-1.9
Labour Ros Sanders29612.1-2.7
Green Paul Hill803.3-1.0
Liberal Democrats Juliet Thompson522.1-0.4
Majority
Turnout 32.89
Conservative hold Swing

St. Laurence

St. Laurence
PartyCandidateVotes%±%
Conservative Mark Flewitt 824 38.2 +0.9
UKIP Viv White43720.3-6.8
Labour Reg Copley37017.1+2.5
Independent Kat Woodley24511.3N/A
Liberal Democrats Ashley Thompson21810.1-2.4
Green Tanya Rayment643.0-2.5
Majority
Turnout 29.02
Conservative hold Swing

St. Luke's

St. Luke's
PartyCandidateVotes%±%
Independent Brian Ayling 838 37.0 -4.1†
Labour Donna Richardson47320.9+3.5
Conservative Del Thomas46420.5-0.4
UKIP David Stansfield35215.6-2.2
Green Jason Pilley1044.6-0.2
Liberal Democrats Tomasz Lachowicz311.4-1.6
Majority
Turnout 28.33
Independent hold Swing

† percentage change compared to 2012 election

Thorpe

Thorpe
PartyCandidateVotes%±%
Independent Mike Stafford 1,873 63.1 -6.7†
Conservative Jon Bacon47516.0-10.3
UKIP Clive Cowan29710.0N/A
Labour Rod Birks1846.2+1.1
Green Jo Bates832.8-1.4
Liberal Democrats James Clinkscales561.9-0.5
Majority
Turnout 40.04
Independent hold Swing

† percentage change compared to 2012 election

Victoria

Victoria
PartyCandidateVotes%±%
Labour Ian Gilbert 987 54.7 +14.0
UKIP Peter Breuer35719.8-2.7
Conservative Dennis Garne27615.3-8.2
Green Ian Hurd1176.5-2.5
Liberal Democrats Donna Collins663.7-0.5
Majority
Turnout 24.99
Labour hold Swing

West Leigh

West Leigh
PartyCandidateVotes%±%
Conservative John Lamb 1,219 44.6 -7.5
Liberal Democrats Chris Bailey76928.1+8.5
UKIP Lesley Martin31311.4-2.6
Labour Ian Pope2358.6-1.0
Independent Gabriella Terry1084.0N/A
Green Sarah Yapp893.3-1.5
Majority
Turnout 38.65
Conservative hold Swing

West Shoebury

West Shoebury
PartyCandidateVotes%±%
Conservative Derek Jarvis 810 36.0 -2.0
Independent Peter Lovett76734.1N/A
UKIP Lenny Lierens34415.3-6.1
Labour Joseph Saunders23010.2-2.3
Liberal Democrats Carole Roast552.4-2.3
Green Stephen Jordan442.0-4.8
Majority
Turnout 30.76
Conservative hold Swing

Westborough

Westborough
PartyCandidateVotes%±%
Labour Anne Jones 693 33.9 +0.6
Independent Dr Vel45122.1-11.2†
Conservative Daryl Peagram31715.5-13.9
UKIP Frank Snell26312.9N/A
Green Paul Mansfield1246.1-5.6
Liberal Democrats Pamela Austin1195.8-2.2
Independent Alan Hart773.8-0.3
Majority
Turnout 27.63
Labour gain from Independent Swing

Related Research Articles

<span class="mw-page-title-main">Rochford and Southend East (UK Parliament constituency)</span> Parliamentary constituency in the United Kingdom, 1997 onwards

Rochford and Southend East is a constituency represented in the House of Commons of the UK Parliament since 2005 by Sir James Duddridge, a Conservative.

<span class="mw-page-title-main">Southend West (UK Parliament constituency)</span> Parliamentary constituency in the United Kingdom, 1950 onwards

Southend West is a constituency in the House of Commons of the UK Parliament. The seat is currently held by Anna Firth who won the 2022 by-election, following the murder of the incumbent MP, David Amess.

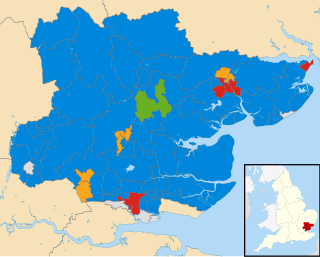
Essex County Council in England is elected every four years. Since the last boundary changes in 2005, 75 councillors are elected from 70 wards.

<span class="mw-page-title-main">Chalkwell</span> British political subdivision & district in Southend-on-Sea, Essex, England

Chalkwell is a suburb of the city of Southend-on-Sea, in the ceremonial county of Essex, England. It is situated on the north bank of the Thames Estuary and is in traditional terms still part of Westcliff-on-Sea. The ward of Chalkwell is bordered by Woodfield Road, Leigh-on-Sea to the west, London Road to the North and Valkyrie Road, Westcliff-on-Sea to the east.

Southend-on-Sea City Council, formerly known as Southend-on-Sea Borough Council, is the local authority for the unitary authority of Southend-on-Sea in Essex, England. Until 1 April 1998 it was a non-metropolitan district.

The 2002 Southend-on-Sea Council election took place on 2 May 2002 to elect members of Southend-on-Sea Unitary Council in Essex, England. One third of the council was up for election and the Conservative party stayed in overall control of the council.

The 2008 Southend-on-Sea Council election took place on 1 May 2008 to elect members of Southend-on-Sea Unitary Council in Essex, England. One third of the council was up for election and the Conservative party stayed in overall control of the council.

<span class="mw-page-title-main">Southend-on-Sea City Council</span> Local authority of Southend-on-Sea, Essex, England

Southend-on-Sea City Council is the local authority of the Southend-on-Sea district in Essex, England. It is a unitary authority, having the powers of a non-metropolitan county and district council combined. It is a member of the East of England Local Government Association. It is based at Southend Civic Centre in Southend-on-Sea.

<span class="mw-page-title-main">2014 Calderdale Metropolitan Borough Council election</span>

The 2014 Calderdale Metropolitan Borough Council election took place on 22 May 2014 to elect members of Calderdale Metropolitan Borough Council in England. This was on the same day as local elections across the United Kingdom and a European election. One councillor was elected in each of the 17 wards for a four-year term. There are three councillors representing each ward elected on a staggered basis so one third of the councillor seats were up for re-election. The seats had previously been contested in 2010 which was held in conjunction with a general election. The turnout was significantly lower in 2014 than in 2010 which is not unusual when comparing local elections that coincide with general elections to ones that do not. Prior to the election Labour was the largest party in the council with 21 out of 51 seats, 5 seats short of an overall majority. After the election there was no overall control of the council. Labour had 25 seats, only one short of a majority and so Labour continued to operate a minority administration.

<span class="mw-page-title-main">2014 Havant Borough Council election</span>

The 2014 Havant Borough Council election took place on 22 May 2014 to elect members of Havant Borough Council in Hampshire, England. One third of the council was up for election and the Conservative Party stayed in overall control of the council.

<span class="mw-page-title-main">2015 City of Bradford Metropolitan District Council election</span>

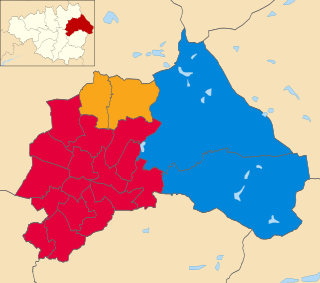
The 2015 City of Bradford Metropolitan District Council election took place on 7 May 2015. This was on the same day as other local elections and a general election. One councillor was elected in each ward for a four-year term so the councillors elected in 2015 last stood for election in 2011. Each ward is represented by three councillors, the election of which is staggered, so only one third of the councillors were elected in this election. Labour retained overall control of the council.

<span class="mw-page-title-main">2016 Calderdale Metropolitan Borough Council election</span> 2016 local election in England

The 2016 Calderdale Metropolitan Borough Council election took place on 5 May 2016 to elect members of Calderdale Metropolitan Borough Council in England. This was on the same day as other local elections. One councillor was elected in each ward for a four-year term so the councillors elected in 2016 last stood for election in 2012. Each ward is represented by three councillors, the election of which is staggered, so only one third of the councillors was elected in this election. Before the election there was no overall control with a minority Labour administration. After the election there was still no overall control so the minority Labour administration continued.

<span class="mw-page-title-main">2016 Fareham Borough Council election</span>

The 2016 Fareham Borough Council election took place on 5 May 2016 to elect members of Fareham Borough Council in England. This was on the same day as other local elections.

<span class="mw-page-title-main">2017 Essex County Council election</span>

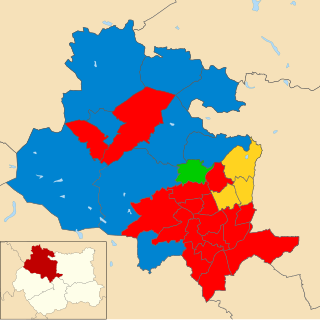
Elections to Essex County Council took place on 4 May 2017 as part of the 2017 local elections. All 75 councillors were elected from 70 electoral divisions, which each returned either one or two councillors by first-past-the-post voting for a four-year term of office.

<span class="mw-page-title-main">2018 Colchester Borough Council election</span>

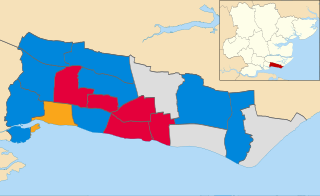
Elections to Colchester Borough Council took place on 3 May 2018. Seventeen members of the council - one-third of the whole - were elected, one from each of the seventeen wards. It was the first standard election to take place following comprehensive boundary changes in 2016. This set of seats were last up for election in 2016, with the third-placed elected candidates being up for election in 2018.

<span class="mw-page-title-main">2018 Thurrock Council election</span>

The 2018 Thurrock Council elections took place on 3 May 2018 to elect members of Thurrock Council in England. Councillors in 16 out of the 20 electoral wards were to be up for election. The council remained under no overall control, with a minority Conservative administration running the council.

<span class="mw-page-title-main">2018 Oldham Metropolitan Borough Council election</span>

The 2018 Oldham Council election took place on 3 May 2018 to elect members of Oldham Council in England. The election took place on the same day as other local elections in England. The election saw the majority Labour Party increase its number of seats by two. The Conservative Party also gained two seats, while the Liberal Democrats lost one seat. UKIP ceased to have representation on the council following this election. The election left Labour with 47 seats, the Liberal Democrats 8 and the Conservatives 4 with the remaining seat being held by an Independent.

<span class="mw-page-title-main">2018 Southend-on-Sea Borough Council election</span>

Elections to Southend-on-Sea Borough Council took place on 3 May 2018. This was on the same day as other local elections across the United Kingdom.

<span class="mw-page-title-main">2019 Southend-on-Sea Borough Council election</span>

Elections to Southend-on-Sea Borough Council took place on 2 May 2019. This was on the same day as other local elections across the United Kingdom.

<span class="mw-page-title-main">2021 Southend-on-Sea Borough Council election</span>

Elections to Southend-on-Sea Borough Council took place on 6 May 2021. This was on the same day as other local elections across the United Kingdom. The results saw the Conservatives and Labour pick up seats at the expense of the local Independents.

References

  1. "2016 Borough Council Election". southend.gov.uk. Southend-on-Sea Borough Council. Archived from the original on 27 June 2016. Retrieved 12 October 2023.
  2. "Guide to May 2016 elections in Scotland, Wales, England and Northern Ireland". BBC News. Retrieved 21 April 2016.