2017 United Kingdom local elections

Last updated

2017 United Kingdom local elections
Flag of the United Kingdom.svg
  2016 4 May 2017 2018  

All 27 county councils, all 32 Scottish council areas,
all 22 Welsh principal councils, 6 out of 55 unitary authorities,
1 out of 36 metropolitan boroughs, 1 sui generis authority,
and 8 directly elected mayors
Turnout35% [1]
  Theresa May election infobox.jpg Jeremy Corbyn closeup.jpg Official portrait of Tim Farron MP crop 2.jpg
Leader Theresa May Jeremy Corbyn Tim Farron
Party Conservative Labour Liberal Democrats
Leader since11 July 201612 September 201516 July 2015
Popular vote [n 1] 38%27%18%
Swing [n 2] Increase2.svg8%Decrease2.svg4%Increase2.svg3%
Councils2890
Councils +/–Increase2.svg11Decrease2.svg7Steady2.svg
Councillors1,8991,152441
Councillors +/–Increase2.svg563Decrease2.svg382Decrease2.svg42

  Nicola Sturgeon election infobox 3.jpg Leanne Wood AM (27555056394).jpg
Leader Nicola Sturgeon Leanne Wood
Party SNP Plaid Cymru
Leader since14 November 201416 March 2012
Councils01
Councils +/–Decrease2.svg1Increase2.svg1
Councillors431208
Councillors +/–Decrease2.svg 7 [2] Increase2.svg38

2017 UK local elections - Ward and Council Control.svg
Map showing council control (left) and largest party by ward or division (right) following the election.
   Labour
   Liberal Democrats    
  No election on 4 May 2017

The 2017 United Kingdom local elections were held on Thursday 4 May 2017. Local elections were held across Great Britain, with elections to 35 English local authorities and all councils in Scotland and Wales.

Contents

Newly created combined authority mayors were directly elected in six areas of England: Cambridgeshire and Peterborough, Greater Manchester, the Liverpool City Region, Tees Valley, the West Midlands, and the West of England. [3] In addition, Doncaster and North Tyneside re-elected local authority mayors. [3] Local by-elections for 107 council seats also took place on 4 May. [4]

The Conservative Party led under Prime Minister Theresa May enjoyed the best local election performance in a decade, making significant gains at the expense of the Labour Party. [5] The UK Independence Party lost every seat they were defending, but gained just one seat at the expense of the Labour Party. [5] The Liberal Democrats lost 41 seats, despite their vote share increasing. [6] [7] [8] The Conservatives won four out of six metro-mayoral areas, [9] including in the traditionally Labour-voting Tees Valley and West Midlands.

The local elections were followed by a general election on 8 June.

Eligibility to vote

All registered electors (British, Irish, Commonwealth and European Union citizens) who were aged 18 or over (or aged 16 or over in Scotland) [10] on polling day were entitled to vote in the local elections. [11] A person who had two homes (such as a university student having a term-time address and living at home during holidays) could register to vote at both addresses as long as they were not in the same electoral area, and could vote in the local elections for the two different local councils. [12]

Individuals had to be registered to vote by midnight twelve working days before polling day (13 April 2017 in England and Wales; 17 April 2017 in Scotland). [13] [14] Anyone qualifying as an anonymous elector had until midnight on 25 April 2017 to register. [15]

Seats held prior to the election

In total, 4,851 council seats were up for election in 88 councils; additionally six new mayors were directly elected. [16] Approximately 10,000 people were candidates for election. [17] All 32 councils in Scotland (1,227 seats) and all 22 councils in Wales (1,254 seats) were up for election; an additional 34 councils (2,370 seats) in England were up for election. [16] Of the 35 English councils up for election, 27 were county councils, seven were unitary authorities, and one was the Doncaster Metropolitan Borough Council. [18]

According to a BBC News estimate, taking into account boundary changes, the major political parties were effectively defending the following notional results in council seats on election day:

There were also 687 independent councillors and 4 Mebyon Kernow councillors. The remaining 217 seats were held by residents' associations and minor parties. [19] A by-election for the parliamentary constituency of Manchester Gorton (caused by the death of Sir Gerald Kaufman, the sitting MP) was due to be held on the same day as the local election, but the by-election was cancelled after the general election was called for the following month. [17]

Results

Overview map of council election results
Conservative hold
Conservative gain from No overall control
Conservative gain from Labour
Labour hold
Labour lose to Independent majority or No overall control
Scottish National Party lose to No overall control (Dundee City)
Plaid Cymru hold
Majority of independent councillors, no change
Majority of independent councillors lose to No overall control
No overall control, no change
No election on 4 May 2017 United Kingdom local elections, 2017 - Control Change.svg
Overview map of council election results
   Conservative hold
   Conservative gain from No overall control
   Conservative gain from Labour
   Labour hold
   Labour lose to Independent majority or No overall control
   Scottish National Party lose to No overall control (Dundee City)
   Plaid Cymru hold
   Majority of independent councillors lose to No overall control
   No overall control, no change
  No election on 4 May 2017

Overall results - Great Britain

PartyCouncils [20] Councillors
NumberChangeNumberChange
Conservative 28Increase2.svg111,899Increase2.svg563
Labour 9Decrease2.svg71,152Decrease2.svg382
Independent 6Increase2.svg1656Decrease2.svg13
Liberal Democrats 0Steady2.svg441Decrease2.svg42
SNP 0Decrease2.svg1431Decrease2.svg7
Plaid Cymru 1Increase2.svg1208Increase2.svg38
Green 0Steady2.svg21Increase2.svg1
Scottish Green 0Steady2.svg19Increase2.svg5
RA 0Steady2.svg11Decrease2.svg2
Llais Gwynedd 0Steady2.svg6Decrease2.svg7
Mebyon Kernow 0Steady2.svg4Steady2.svg
Health Concern 0Steady2.svg2Decrease2.svg1
UKIP 0Steady2.svg1Decrease2.svg145
Liberal 0Steady2.svg0Decrease2.svg3
Others0Steady2.svg0Steady2.svg
No overall control 44Decrease2.svg4n/an/a
Total4,851

As elections were not held throughout the country, the  BBC  calculated a Projected National Vote Share (PNV), which aims to assess what the council results indicate the UK-wide vote would be "if the results were repeated at a general election". The BBC's preliminary Projected National Vote Share was 38% for the  Conservatives, 27% for  Labour, 18% for the  Liberal Democrats  and 5% for the UK Independence Party, with others on around 12%. [21]

This is the highest vote share for the Conservatives in local elections since 2008, when they faced Labour a decade into government and suffering from the financial crisis. The Liberal Democrats have performed better than at any election since 2010, whilst Labour has not performed so badly since 2010.[ citation needed ]

UKIP lost 145 of their 146 seats. Prominent former UKIP members talked of the party being finished and that it should disband. [22] [23] [24]

Results by nation

England

PartyVotes [25] Vote %+/-Councils [26] +/-Seats+/-
Conservative 3,036,70946.5%Increase2.svg12.2%27Increase2.svg101,439Increase2.svg319
Labour 1,299,84619.9%Decrease2.svg1.6%2Decrease2.svg1418Decrease2.svg142
Liberal Democrats 1,164,77917.8%Increase2.svg4.2%0Steady2.svg312Decrease2.svg28
UKIP 302,3684.6%Decrease2.svg15.6%0Steady2.svg1Decrease2.svg143
Green 284,7354.4%Increase2.svg0.8%0Steady2.svg20Steady2.svg
Others438,9856.7%Decrease2.svg0.2%0Steady2.svg199Decrease2.svg6
No overall control n/an/an/a5Decrease2.svg9n/an/a
Total6,545,055100342,389

Note that unlike in Scotland and Wales, where all local authorities were up for election, the England results are for only 34 councils out of 353, and should not be taken as reflective of the whole of England.

Wales

PartyVotes [27]  %+/-Councils+/-Seats+/-
Labour 294,98930.4%Decrease2.svg4.5%7Decrease2.svg3468Decrease2.svg112
Independent 218,81722.5%Decrease2.svg1.3%3Increase2.svg1309Increase2.svg2
Conservative 182,52018.8%Increase2.svg6.3%1Increase2.svg1184Increase2.svg79
Plaid Cymru 160,51916.5%Increase2.svg0.5%1Increase2.svg1208Increase2.svg38
Liberal Democrats 66,0226.8%Decrease2.svg1.2%0Steady2.svg63Decrease2.svg10
Green 12,4411.3%Increase2.svg0.2%0Steady2.svg1Increase2.svg1
UKIP 11,0061.1%Increase2.svg0.3%0Steady2.svg0Decrease2.svg2
Others24,5942.5%Decrease2.svg0.3%0Steady2.svg21Decrease2.svg7
No overall control n/an/an/a10Increase2.svg1n/an/a
Total970,908100221,254

For comparative purposes, the table above shows changes since 2012 across 21 local authorities and the 2013 result from Anglesey Council.

Scotland

Following boundary changes:

Summary of the 4 May 2017 Scottish council election results [28] [29]
PartyFirst-preference votesCouncils+/-2012 seats2017 seatsSeat change
Seats won NotionalSeats wonSeat %vs Notional
Scottish National Party 610,45432.3%Steady2.svg0.00Decrease2.svg142543843135.1%Decrease2.svg7
Conservative 478,07325.3%Increase2.svg12.0%0Steady2.svg11511227622.5%Increase2.svg164
Labour 380,95720.2%Decrease2.svg11.4%0Decrease2.svg339439526221.4%Decrease2.svg133
Independents 196,43810.4%Decrease2.svg1.4%3Steady2.svg19619816814.1%Decrease2.svg30
Liberal Democrats 130,2436.9%Increase2.svg0.3%0Steady2.svg7170675.5%Decrease2.svg3
Green 77,6824.1%Increase2.svg1.8%0Steady2.svg1414191.6%Increase2.svg5
Orkney Manifesto Group 8940.0%0Steady2.svg20.1%New
West Dunbartonshire Community 2,4130.1%0Steady2.svg10.1%New
The Rubbish Party 7840.0%0Steady2.svg10.1%New
UK Independence Party 2,9200.2%Decrease2.svg0.1%0Steady2.svg0.0%Steady2.svg
Independent Alliance North Lanarkshire2,8230.2%0Steady2.svg0.0%Steady2.svg
TUSC 1,4030.1%0Steady2.svg0.0%Steady2.svg
A Better Britain – Unionist Party 1,1960.1%0Steady2.svg0.0%Steady2.svg
Scottish Socialist 9280.0%Decrease2.svg0.3%0Steady2.svg100.0%Decrease2.svg1
Solidarity 8830.0%0Steady2.svg0.0%Steady2.svg
Libertarian 7760.0%0Steady2.svg0.0%Steady2.svg
RISE 1860.0%0Steady2.svg0.0%Steady2.svg
Scottish Independent Network1450.0%0Steady2.svg0.0%Steady2.svg
Scottish Unionist 1290.0%0Steady2.svg0.0%Steady2.svg
Social Democratic 1120.0%0Steady2.svg0.0%Steady2.svg
Scottish Christian 1040.0%0Steady2.svg0.0%Steady2.svg
Socialist Labour 760.0%0Steady2.svg0.0%Steady2.svg
National Front 390.0%0Steady2.svg0.0%Steady2.svg
No Overall Control 29Increase2.svg4
Total1,889,658100.0±0.032Steady2.svg1,2231,2271,227100.00Steady2.svg

The table has been arranged according to popular vote, not the number of seats won.

There were boundary changes in many of these councils, with an increase in council seats across the country from 1,223 to 1,227, making direct comparisons with the 2012 results problematic. Notional seats and seat change are based on a notional 2012 result calculated by the BBC. [30] [31]

Maps

Council control
(voting areas only)
Council control
(whole UK)
Before electionsAfter electionsBefore electionsAfter elections
United Kingdom local elections, 2017 - Control Before.svg United Kingdom local elections, 2017 - Control After.svg United Kingdom local elections, 2017 - Control Before Plus.svg United Kingdom local elections, 2017 - Control After Plus.svg
  No council election on 4 May 2017
Largest party by popular vote
(including mayoral elections)
Conservative
Labour
SNP
Plaid Cymru
Independents
010203040 %
and its vote shareand the size of its majority
United Kingdom local elections, 2017 - First Party Vote Share.svg United Kingdom local elections, 2017 - First Party Majority.svg
  No election on 4 May 2017

England

Map of previous control of councils up for election.
Conservative
Labour
Scottish National Party
Majority of independent councillors
No overall control
No election on 4 May 2017 United Kingdom local elections, 2017 - Previous Control.svg
Map of previous control of councils up for election.

Non-metropolitan county councils

All 27 county councils for areas with a two-tier structure of local governance had all of their seats up for election. These were first-past-the-post elections in a mixture of single-member and multi-member electoral divisions.[ citation needed ]

These were the last elections to Dorset and Northamptonshire county councils.

CouncilPrevious controlResultDetails
Buckinghamshire Conservative Conservative Details
Cambridgeshire No overall control (Cons. plurality) Conservative Details
Cumbria No overall control (Lab. and Lib. Dem. coalition) No overall control (Lab. and Lib. Dem. coalition) Details
Derbyshire Labour Conservative Details
Devon Conservative Conservative Details
Dorset Conservative Conservative Details
East Sussex No overall control (Cons. plurality) Conservative Details
Essex Conservative Conservative Details
Gloucestershire [32] No overall control (Cons. plurality) Conservative Details
Hampshire Conservative Conservative Details
Hertfordshire Conservative Conservative Details
Kent Conservative Conservative Details
Lancashire No overall control (Lab. plurality w. Lib. Dem. support) Conservative Details
Leicestershire Conservative Conservative Details
Lincolnshire No overall control (Cons. and Lib. Dem. coalition) Conservative Details
Norfolk No overall control (Cons. plurality)† Conservative Details
North Yorkshire Conservative Conservative Details
Northamptonshire Conservative Conservative Details
Nottinghamshire Labour No overall control (Cons. and independent coalition) [33] [34] Details
Oxfordshire [35] No overall control (Cons. plurality) No overall control (Cons. and independent coalition) [36] [37] Details
Somerset Conservative Conservative Details
Staffordshire Conservative Conservative Details
Suffolk No overall control (Cons. plurality) Conservative Details
Surrey Conservative Conservative Details
Warwickshire No overall control [38] (Cons. plurality) Conservative Details
West Sussex Conservative Conservative Details
Worcestershire Conservative Conservative Details
‡ New electoral division boundaries [39]
† The Conservatives lost control in 2013, and were replaced by a Labour/UKIP/Lib Dem coalition with Independent/Green support. The Conservatives regained the council leadership in May 2016 after the Green Party abstained in the annual Council leadership election, and by-elections and defections later brought the Conservative total to 42 seats, giving them exactly 50% of the seats. [40]

Unitary authorities

Six single-tier unitary authorities held elections, with all of their seats up for election. These were first-past-the-post elections in a mixture of single-member and multi-member electoral divisions or wards.[ citation needed ]

CouncilCouncil
seats up
for election
Previous controlResultDetails
Cornwall All No overall control [41] (Lib. Dem. and independents coalition) No overall control (Lib. Dem. and independents coalition) [42] [43] Details
Durham All Labour Labour Details
Isle of Wight All No overall control (Cons. plurality) Conservative Details
Northumberland All No overall control (Lab. plurality) No overall control (Cons. plurality) [44] Details
Shropshire All Conservative Conservative Details
Wiltshire All Conservative Conservative Details

Metropolitan boroughs

One metropolitan borough, the Metropolitan Borough of Doncaster, had all of its seats up for election, after moving to whole council elections in 2015. [45] This was a first-past-the-post election in a mixture of two-member and three-member wards.

CouncilPrevious controlResultDetails
Doncaster Labour Labour Details

Isles of Scilly

The Council of the Isles of Scilly was created by the Local Government Act 1888, meaning they lie outside the classifications of authorities used in the rest of England.

CouncilProportion up
for election
Previous controlResultDetails
Isles of Scilly All Independent Independent hold Details

Mayoral elections

Map of the regional combined authority mayoralties up for election in 2017. United Kingdom local elections, 2017 - Mayoral Elections.svg
Map of the regional combined authority mayoralties up for election in 2017.

Combined authority mayors

Six elections were held for directly elected regional mayors. These newly established positions lead combined authorities set up by groups of local councils, as part of devolution deals giving the combined authorities additional powers and funding.

Combined authorityInterim mayor/chairResultDetails
Cambridgeshire and Peterborough Robin Howe (Con)James Palmer (Con) Details
Greater Manchester Tony Lloyd (Lab) Andy Burnham (Lab) Details
Liverpool City Region Joe Anderson (Lab) Steve Rotheram (Lab) Details
Tees Valley Sue Jeffrey (Lab) Ben Houchen (Con) Details
West of England Matthew Riddle (Con) Tim Bowles (Con) Details
West Midlands Bob Sleigh (Con) Andy Street (Con) Details

Other planned mayoralties have been postponed or cancelled. [46] The election of the Sheffield City Region Combined Authority mayor was postponed in January 2017 [47] and, following legal action, did not occur until the 2018 local elections. [48] The North East Combined Authority deal was scrapped as several councils in the region voted down the proposal, [49] however the smaller North of Tyne combined authority was approved by the councils and by parliament for the 2019 local elections. [50] The other devolution deals that were scrapped were for the Norfolk and Suffolk, [51] Greater Lincolnshire [52] and the Solent. [53]

There were concerns at the low turnout recorded. [54] [7]

Local authority mayors

Two elections for directly elected local district mayors will be held. These Mayors act as council leaders in their local authorities.

Local AuthorityIncumbent mayorResultDetails
Doncaster Ros Jones (Lab) Ros Jones (Lab) Details
North Tyneside Norma Redfearn (Lab) Norma Redfearn (Lab) Details

Scotland

Map of the Scottish results. 2017 Scottish local elections - Ward and Council Control.svg
Map of the Scottish results.
CouncilPrevious controlResultDetails
Aberdeen City No overall control No overall control Details
Aberdeenshire SNP No overall control Details
Angus No overall control No overall control Details
Argyll and Bute No overall control No overall control Details
Clackmannanshire No overall control No overall control Details
Dumfries and Galloway No overall control No overall control Details
Dundee City SNP No overall control Details
East Ayrshire No overall control No overall control Details
East Dunbartonshire No overall control No overall control Details
East Lothian No overall control No overall control Details
East Renfrewshire No overall control No overall control Details
City of Edinburgh No overall control No overall control Details
Falkirk No overall control No overall control Details
Fife No overall control No overall control Details
Glasgow City Labour No overall control Details
Highland No overall control No overall control Details
Inverclyde No overall control No overall control Details
Midlothian No overall control No overall control Details
Moray No overall control No overall control Details
Na h-Eileanan Siar Independent Independent Details
North Ayrshire No overall control No overall control Details
North Lanarkshire No overall control No overall control Details
Orkney Independent Independent Details
Perth and Kinross No overall control No overall control Details
Renfrewshire Labour No overall control Details
Scottish Borders No overall control No overall control Details
Shetland Independent Independent Details
South Ayrshire No overall control No overall control Details
South Lanarkshire Labour No overall control Details
Stirling No overall control No overall control Details
West Dunbartonshire Labour No overall control Details
West Lothian No overall control No overall control Details

Wales

Map of the Welsh results. 2017 Welsh Local Elections - Ward and Council Control.svg
Map of the Welsh results.
CouncilPrevious controlResultDetails
Isle of Anglesey No overall control No overall control Details
Blaenau Gwent Labour Independent Details
Bridgend Labour No overall control Details
Caerphilly Labour Labour Details
Cardiff Labour Labour Details
Carmarthenshire No overall control No overall control Details
Ceredigion No overall control No overall control Details
Conwy No overall control
(PC, Lab., Lib. Dem., and independents coalition) †
No overall control Details
Denbighshire No overall control
(PC, independents, and Cons. coalition) ‡
No overall control Details
Flintshire No overall control No overall control Details
Gwynedd Plaid Cymru†† Plaid Cymru Details
Merthyr Tydfil Labour Independent Details
Monmouthshire No overall control Conservative Details
Neath Port Talbot Labour Labour Details
Newport Labour Labour Details
Pembrokeshire Independent Independent Details
Powys Independent No overall control Details
Rhondda Cynon Taff Labour Labour Details
Swansea Labour Labour Details
Torfaen Labour Labour Details
Vale of Glamorgan No overall control No overall control Details
Wrexham No overall control No overall control Details
† In 2014, the only Welsh Liberal Democrat cabinet member defected to Welsh Labour; thus the Liberal Democrats left the coalition. [55]
In 2015, several Independent councillors created their own group within the council called Conwy First. This group later on went to support the council[ clarification needed ] instead of the remaining five independent councillors, so that the coalition was then made up of Plaid Cymru, Welsh Labour and Conwy First. [56]
‡ The Welsh Liberal Democrats later lost their only seat on the Council, thereby leaving the coalition. [57] [58]
†† At the original election Plaid Cymru won exactly half the seats; they later took control of the council by winning a by-election.

See also

Notes

  1. All vote shares in the infobox are projected national vote shares calculated by the BBC.
  2. Swing figures are between the BBC national projected vote share extrapolation from 2016 local elections, and the BBC equivalent vote share projection from these local elections held in different areas.

Related Research Articles

<span class="mw-page-title-main">Politics of Scotland</span>

The politics of Scotland operate within the constitution of the United Kingdom, of which Scotland is a country. Scotland is a democracy, being represented in both the Scottish Parliament and the Parliament of the United Kingdom since the Scotland Act 1998. Most executive power is exercised by the Scottish Government, led by the First Minister of Scotland, the head of government in a multi-party system. The judiciary of Scotland, dealing with Scots law, is independent of the legislature and the Scottish Government. Scots law is primarily determined by the Scottish Parliament. The Scottish Government shares some executive powers with the Scotland Office, a British government department led by the Secretary of State for Scotland.

<span class="mw-page-title-main">English Democrats</span> English political party

The English Democrats is a right-wing to far-right, English nationalist political party active in England. Being a minor party, it currently has no elected representatives at any level of UK government.

In the context of local authorities in the United Kingdom, no overall control is a situation in which no single political group achieves a majority of seats, analogous to a hung parliament. Of the 248 councils who had members up for election in the 2019 local elections, 73 resulted in a NOC administration. In the 2021 election, 14 resulted in no overall control. The term can still be used for several other countries, such as for two local councils of Malta and the General Assembly of Budapest in Hungary.

<span class="mw-page-title-main">2006 United Kingdom local elections</span>

The 2006 United Kingdom local elections were held on Thursday 4 May 2006.

<span class="mw-page-title-main">Politics of Bristol</span> Overview of the politics of Bristol

The city of Bristol, England, is a unitary authority, represented by four MPs representing seats wholly within the city boundaries. As well as these, Filton and Bradley Stoke covers the northern urban fringe in South Gloucestershire and the north eastern urban fringe is in the Kingswood constituency. The overall trend of both local and national representation became left of centre during the latter 20th century, but there was a shift to the right in the 2010 general election. The city has a tradition of local activism, with environmental issues and sustainable transport being prominent issues in the city.

<span class="mw-page-title-main">2011 United Kingdom local elections</span>

The 2011 United Kingdom local elections was held on Thursday May 5. In England, direct elections were held in all 36 Metropolitan boroughs, 194 Second-tier district authorities, 49 unitary authorities and various mayoral posts, meaning local elections took place in all parts of England with the exception of seven unitary authorities, and seven districts and boroughs. For the majority of English districts and the 25 unitary authorities that are elected "all out" these were the first elections since 2007. In Northern Ireland, there were elections to all 26 local councils. Elections also took place to most English parish councils.

<span class="mw-page-title-main">2012 City of Lincoln Council election</span> UK municipal election

The 2012 City of Lincoln Council election took place on 3 May 2012 to elect one-third of the members of City of Lincoln Council in Lincolnshire, England, for a 4-year term of office. This was on the same day as other 2012 United Kingdom local elections.

<span class="mw-page-title-main">2013 United Kingdom local elections</span>

The 2013 United Kingdom local elections took place on Thursday 2 May 2013. Elections were held in 35 English councils: all 27 non-metropolitan county councils and eight unitary authorities, and in one Welsh unitary authority. Direct mayoral elections took place in Doncaster and North Tyneside. These elections last took place on the 4 June 2009 at the same time as the 2009 European Parliament Elections, except for County Durham, Northumberland and the Anglesey where elections last took place in 2008.

<span class="mw-page-title-main">2014 European Parliament election in the United Kingdom</span> Election

The 2014 European Parliament election was the United Kingdom's component of the 2014 European Parliament election, held on Thursday 22 May 2014, coinciding with the 2014 local elections in England and Northern Ireland. In total, 73 Members of the European Parliament were elected from the United Kingdom using proportional representation. England, Scotland and Wales use a closed-list party list system of PR, while Northern Ireland used the single transferable vote (STV).

<span class="mw-page-title-main">2014 United Kingdom local elections</span>

The 2014 United Kingdom local elections were held on 22 May 2014. Usually these elections are held on the first Thursday in May but were postponed to coincide with the 2014 European Parliament Elections. Direct elections were held for all 32 London boroughs, all 36 metropolitan boroughs, 74 district/borough councils, 19 unitary authorities and various mayoral posts in England and elections to the new councils in Northern Ireland.

<span class="mw-page-title-main">2013 Lincolnshire County Council election</span>

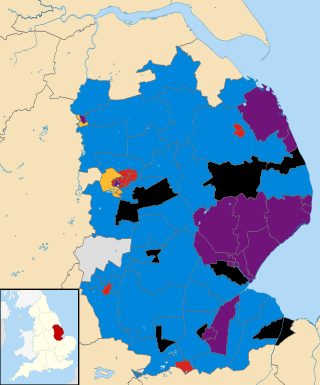
An election to Lincolnshire County Council took place on 2 May 2013 as part of the 2013 United Kingdom local elections. 77 electoral divisions returned one county councillor each by first-past-the-post voting for a four-year term of office. The electoral divisions were the same as those used at the previous election in 2009. No elections were held in North Lincolnshire or North East Lincolnshire, which are unitary authorities outside the area covered by the County Council.

<span class="mw-page-title-main">2015 United Kingdom local elections</span>

The 2015 United Kingdom local elections were held on Thursday 7 May 2015, the same day as the general election for the House of Commons of the United Kingdom.

<span class="mw-page-title-main">2015 United Kingdom general election</span>

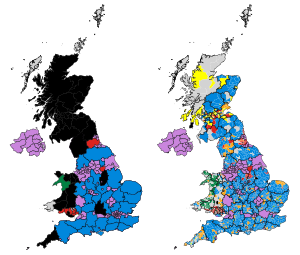
The 2015 United Kingdom general election was held on Thursday 7 May 2015 to elect 650 Members of Parliament to the House of Commons. It was the only general election held under the rules of the Fixed-term Parliaments Act 2011 and was the last general election to be held before the United Kingdom would vote to end its membership of the European Union (EU). Local elections took place in most areas of England on the same day.

<span class="mw-page-title-main">2016 United Kingdom local elections</span>

The 2016 United Kingdom local elections held on Thursday 5 May 2016 were a series of local elections which were held in 124 local councils and also saw 4 mayoral elections in England which also coincided with elections to the Scottish Parliament, the Welsh Assembly, the Northern Ireland Assembly, the London Assembly, the London mayoral election and the England and Wales Police and crime commissioners. By-elections for the Westminster seats of Ogmore and Sheffield Brightside and Hillsborough were also held. These proved to be David Cameron's last local elections as leader of the Conservative Party and Prime Minister as he resigned two months later following the defeat of Remain in the referendum on Britain's continuing membership of the European Union which was held seven weeks later.

<span class="mw-page-title-main">2016 Exeter City Council election</span>

The 2016 Exeter City Council election took place on 5 May 2016, to elect members of Exeter City Council in England. Following boundary changes, the entire council was up for election, and all 13 wards were contested, each electing three councillors. The election was held concurrently with other local elections held in England on the 5 May.

<span class="mw-page-title-main">2017 West Midlands mayoral election</span> Mayoral election held in the West Midlands, England

The inaugural West Midlands mayoral election was held on 4 May 2017 to elect the Mayor of the West Midlands, with subsequent elections to be held every four years from May 2020. The election took place alongside five elections for English metro mayors and other local elections, and ahead of the general election on 8 June 2017.

<span class="mw-page-title-main">2018 United Kingdom local elections</span>

The 2018 United Kingdom local elections were held on Thursday 3 May 2018, with local council elections taking place in all 32 London boroughs, 34 metropolitan boroughs, 67 district and borough councils and 17 unitary authorities. There were also direct elections for the mayoralties of Hackney, Lewisham, Newham, Tower Hamlets and Watford.

<span class="mw-page-title-main">2019 United Kingdom local elections</span> Elections to local councils and mayoralties

The 2019 United Kingdom local elections took place on Thursday 2 May 2019, with 248 English local councils, six directly elected mayors in England, and all 11 local councils in Northern Ireland being contested.

<span class="mw-page-title-main">2021 United Kingdom local elections</span> Elections to local councils and mayoralties

The 2021 United Kingdom local elections were held on Thursday 6 May 2021. More than 145 English local councils, around 5,000 councillor seats, thirteen directly elected mayors in England, and 39 police and crime commissioners in England and Wales were contested. On the same day, the 2021 Hartlepool by-election took place, and there were also elections to the Scottish Parliament, Senedd and London Assembly, the last in conjunction with the London mayoral election.

<span class="mw-page-title-main">2022 United Kingdom local elections</span> Elections to local councils and mayoralties

The 2022 United Kingdom local elections took place on Thursday 5 May 2022. These included elections for all London borough councils, for all local authorities in Wales and Scotland. Most seats in England were last up for election in 2018 and in Scotland and Wales in 2017. The elections coincided with the 2022 Northern Ireland Assembly election. In 91 cases, most of them in Wales, council seats were uncontested, each having only one candidate. Three seats in Scotland remained unfilled as no one nominated to fill them.

References

  1. Daniel Wainwright (9 April 2019). "Council elections: Why don't people vote?" . Retrieved 20 April 2019.
  2. "Scotland Results". BBC News.
  3. 1 2 "Election 2017: English mayoral candidates". BBC News. 5 April 2017. Retrieved 30 April 2017.
  4. "Local Elections Preview, Part I". election-data.co.uk. 28 April 2017.[ permanent dead link ]
  5. 1 2 "Tories set for best local election results in decade as UKIP obliterated". The Telegraph. Retrieved 5 May 2017.
  6. Elgot, Jessica (5 May 2017). "No Lib Dem resurgence at local elections but share of votes increases". The Guardian. ISSN   0261-3077 . Retrieved 5 May 2017.
  7. 1 2 "The New Statesman 2017 local elections liveblog". www.newstatesman.com. Retrieved 5 May 2017.
  8. "Local elections 2017: Tories make early gains". 5 May 2017. Retrieved 5 May 2017 via bbc.co.uk.
  9. Smith, Mikey (5 May 2017). "Follow all the UK local election results 2017 LIVE". mirror. Retrieved 6 May 2017.
  10. "Scottish Elections (Reduction of Voting Age) Act 2015, Section 1". Legislation.gov.uk. Retrieved 24 April 2017.
  11. "Representation of the People Act 1983, Section 2". Legislation.gov.uk. Retrieved 24 April 2017.
  12. Electoral Commission. "I have two homes. Can I register at both addresses?". electoralcommission.org.uk. The Electoral Commission. Archived from the original on 15 November 2008. Retrieved 24 April 2017.
  13. "Timetable for local elections in England and Wales: 4 May 2017". The Electoral Commission. Archived from the original (doc) on 24 April 2017. Retrieved 24 April 2017.
  14. Note that Easter Monday is a working day in Scotland. "Timetable for Scottish council elections on 4 May 2017" (doc). The Electoral Commission . Retrieved 24 April 2017.
  15. The deadline for the receipt and determination of anonymous electoral registration applications is one working day before the publication date of the notice of alteration to the Electoral Register (that is the sixth working day before polling day). cf "Guidance for Electoral Registration Officers (Part 4 – Maintaining the register throughout the year)" (PDF). Cabinet Office and The Electoral Commission. July 2016. p. 114. Archived from the original (PDF) on 24 April 2017. Retrieved 24 April 2017.
  16. 1 2 Local elections: Voters set to head for the polls, BBC News (3 May 2017).
  17. 1 2 Elections 2017: Polls close across England, BBC News (4 May 2017).
  18. Ashley Cowburn, Local elections 2017: When are they and why could they be so important?,The Independent (3 May 2017).
  19. "A guide to local elections taking place on Thursday". BBC. 3 May 2017.
  20. "Local elections 2017: The results mapped". BBC News. Retrieved 6 May 2017.
  21. "Steve Fisher on Twitter" . Retrieved 6 May 2017.
  22. "Ukip is 'finished as an electoral force' says biggest donor Arron Banks after local election wipeout". telegraph.co.uk. Retrieved 6 May 2017.
  23. "Ukip got what it wanted. Time to disband". theguardian.com. 5 May 2017. Retrieved 6 May 2017.
  24. "Ukip, my old party, is finished. And I'm elated about it". The Guardian. 5 May 2017. Retrieved 6 May 2017.
  25. "English local authorities, 2017". Britain Elects. Archived from the original on 3 September 2017. Retrieved 3 August 2017.
  26. "England local elections 2017". BBC News. Retrieved 6 May 2017.
  27. "Year Tables". 19 December 2015.
  28. "BBC News :: Full Scottish council election results published".
  29. Board, Electoral Management. "Electoral Management Board - SLGE2017 Summary Results Data". www.electionsscotland.info. Archived from the original on 5 July 2019. Retrieved 18 April 2018.
  30. "Scotland Results". BBC News.
  31. "How BBC calculates local election results". 9 May 2017 via www.bbc.com.
  32. "The Cotswold (Electoral Changes) Order 2017" . Retrieved 18 February 2017.
  33. "Conservatives strike coalition deal to take control of Nottinghamshire County Council | Nottingham Post". Archived from the original on 10 May 2017. Retrieved 7 June 2017.
  34. "Conservative-led coalition to run Nottinghamshire CC". www.publicsectorexecutive.com.
  35. "The Cherwell (Electoral Changes) Order 2017" . Retrieved 18 February 2017.
  36. "Tories form alliance to run Oxfordshire". 16 May 2017 via www.bbc.co.uk.
  37. "Find out who will be running Oxfordshire County Council for the next four years". Oxford Mail.
  38. Sian Grzeszczyk (29 April 2013). "BBC News – Warwickshire elections 2013: Conservatives lose control". Bbc.co.uk. Retrieved 3 May 2013.
  39. "Trailer – Local Elections May 2017". gwydir.demon.co.uk. Archived from the original on 1 October 2019. Retrieved 18 February 2017.
  40. Dan Grimmer (9 May 2016). "Conservatives take control of Norfolk County Council as Greens abstain". Eastern Daily Press. Archived from the original on 25 October 2016. Retrieved 9 January 2017.
  41. "Cornwall Council". Cornwall.gov.uk. Archived from the original on 29 April 2013. Retrieved 3 May 2013.
  42. "Lib Dems and independents regain council". 23 May 2017 via www.bbc.co.uk.
  43. "Liberal Democrats and independents retain control of Cornwall Council". Falmouth Packet.
  44. "Tories form new administration at Northumberland County Council". Archived from the original on 17 June 2018. Retrieved 7 June 2017.
  45. "The Borough of Doncaster (Scheme of Elections) Order 2013". legislation.gov.uk. Retrieved 12 August 2016.
  46. Wichmann, Janine (4 January 2017). "So which English cities are actually getting devolution deals?". CityMetric. Retrieved 9 January 2017.
  47. "Devolution poll is axed". Sheffield Telegraph. 12 January 2017. Retrieved 14 January 2017.
  48. "Sheffield's botched 'unlawful' devo consultation likely to cost £500k" . Retrieved 18 February 2017.
  49. Jonathan Walker (8 September 2016). "North East mayor and £900 million devolution deal is scrapped". ChronicleLive. Retrieved 14 January 2017.
  50. Jonathan Walker (2 November 2019). "'A golden era for the North East': The new North of Tyne Combined Authority is launched". ChronicleLive . Retrieved 5 November 2018.
  51. "Norfolk and Suffolk elected mayor plans scrapped". BBC News . 18 November 2016. Retrieved 14 January 2017.
  52. Stefan Pidluznyj (11 November 2016). "Scrapped: Lincolnshire's £450m devolution deal no more". The Lincolnite. Retrieved 14 January 2017.
  53. William Rimell (12 October 2018). "Hampshire County Council leader Roy Perry 'not surprised' by Solent 'super council' deal snub". Southern Daily Echo . Newsquest . Retrieved 5 November 2018.
  54. (now), Andrew Sparrow; Phipps, and Claire; (earlier), Kevin Rawlinson (5 May 2017). "Local elections 2017: Tories make gains as votes counted in England, Wales and Scotland – live" . Retrieved 5 May 2017 via The Guardian.
  55. Staff (4 July 2014). "Conwy: Liberal Democrat councillor Mike Priestley defects to Labour". Daily Post. Retrieved 9 January 2017.
  56. Staff (10 March 2016). "Conwy council Independents in disarray over attempt to oust Plaid Cymru leader". Daily Post. Retrieved 9 January 2017.
  57. "Denbighshire Labour councillor defends opposition". Denbighshirefreepress.co.uk. 13 June 2012. Archived from the original on 20 December 2016. Retrieved 9 January 2017.
  58. "Committee details – Cabinet". Denbighshire County Council. 26 October 2016. Retrieved 9 January 2017.