2017 West Sussex County Council election

Last updated

2017 West Sussex County Council election
Flag of West Sussex.svg
  2013 4 May 2017 2021  

All 70 seats to West Sussex County Council
36 seats needed for a majority
 First partySecond partyThird party
 
Party Conservative Liberal Democrats Labour
Last election4686
Seats won5695
Seat changeIncrease2.svg10Increase2.svg1Decrease2.svg1

West Sussex County Council election results 2017.svg
Map showing the results of the 2017 West Sussex County Council elections.

Council control before election

Conservative

Council control after election

Conservative

The 2017 West Sussex County Council election took place as part of the 2017 local elections in the UK. [1] All councillors were elected for single-member electoral divisions for a four-year term. The voting system used was first-past-the-post.

Contents

Boundary changes to the electoral divisions took effect following a review by the Local Government Boundary Commission for England. [2]

The result was Conservative councillors formed an increased, 20-seat, majority on the council at the loss of the ten UKIP seats. The second-largest party grouping of councillors remained Liberal Democrats, gaining one seat to have nine seats and the balance of the council was formed by five Labour Party councillors, having lost one seat, net.

Results summary

West Sussex County Council election, 2017 [3]
PartySeatsGainsLossesNet gain/lossSeats %Votes %Votes+/−
  Conservative 56133Increase2.svg 1080.051.3112,066+12.9
  Liberal Democrats 932Increase2.svg 112.919.241,923+4.8
  Labour 501Decrease2.svg 17.115.533,897+1.6
  UKIP 0010Decrease2.svg 100.06.313,803-23.0
  Green 0Steady2.svg0.05.111,065+2.6
  Independent 0Steady2.svg0.02.45,293+1.1
  Something New 0Steady2.svg0.00.1199+0.1
  Peace 0Steady2.svg0.00.097n/a
  Monster Raving Loony 0Steady2.svg0.00.041n/a
 Justice Party0Steady2.svg0.00.023n/a
 Patria0Steady2.svg0.00.021n/a

Results by electoral division

West Sussex is composed of 7 districts: Adur District, Arun District, Chichester District, Crawley Borough, Horsham District, Mid Sussex District and Worthing Borough. The following results are grouped by district.

Adur

Lancing
PartyCandidateVotes%±%
Conservative Ann Bridges 1,385 44.4 +23.9
Labour Lee Cowen55017.6+6.5
UKIP Roger Arthur44317.5−36.3
Liberal Democrats Doris Martin43814.1+4.2
Green Paul Hendy2016.4+1.6
Majority83526.8
Turnout 3,11831.1+1.3
Conservative gain from UKIP Swing +30.1
Shoreham North
PartyCandidateVotes%±%
Conservative Debbie Kennard 1,728 51.3
Labour Jed Smith74822.2
UKIP Paul Graysmark3199.5
Liberal Democrats Stephen Martin3049.0
Green Lynn Finnigan2708.0
Majority98029.1
Turnout 2,23929.1
Conservative win (new seat)
Shoreham South
PartyCandidateVotes%±%
Conservative Kevin Boram 1,637 46.3
Labour Stephen Gilbert88525.0
Green Andrew Bradbury39011.0
Liberal Democrats Andrew Tinsley37210.5
UKIP Geoffrey Patmore2527.1
Majority75221.3
Turnout 3,53637.9
Conservative win (new seat)
Sompting & North Lancing
PartyCandidateVotes%±%
Conservative George Barton 1,752 51.7 +21.0
Labour Michael Thornton60617.9+3.3
UKIP Charles Lowe56416.7−28.8
Liberal Democrats Stephen Creed3279.7+5.4
Green Leslie Groves Williams1394.1−0.8
Majority1,14633.8
Turnout 3,38833.3+4.4
Conservative gain from UKIP Swing +24.9
Southwick
PartyCandidateVotes%±%
Conservative David Simmons 1,503 51.6 +15.4
Labour Co-op Leslie Alden83928.8+7.9
Liberal Democrats Holly Creed2187.5−0.3
UKIP Jennifer Greig2117.2−22.8
Green Patrick Ginnelly1444.9−0.2
Majority66422.8+16.6
Turnout 2,91531.4+5.8
Conservative hold Swing

Arun

Angmering and Findon
PartyCandidateVotes%±%
Conservative Deborah Urquhart 1,753 61.5 +17.5
Liberal Democrats David Bass51418.2+9.0
Labour Co-op Darren Pearce38413.5+4.4
UKIP Arthur Lardeur2017.1−30.6
Majority1,23943.3+36.9
Turnout 2,85234.5+3.3
Conservative hold Swing
Arundel and Courtwick
PartyCandidateVotes%±%
Conservative Gary Markwell 1,249 56.3 +14.2
Labour Freddie Tandy37917.1+0.2
Liberal Democrats Mark Foster29813.4+6.4
UKIP John Wallace1657.4−26.7
Green Margaretha Trent1275.7+5.7
Majority87039.2+31.2
Turnout 2,21831.5+3.8
Conservative hold Swing
Bersted
PartyCandidateVotes%±%
Conservative David Edwards 901 33.4 +15.2
Liberal Democrats Martin Smith53119.7−1.0
UKIP Ruth Kenward49818.5−22.5
Labour Vincent McCabe39014.5−5.6
Independent Gillian Yeates27010.0+10.0
Green David Meagher1053.9+3.9
Majority37013.7
Turnout 2,69528.1−0.1
Conservative gain from UKIP Swing +18.9
Bognor Regis East
PartyCandidateVotes%±%
Liberal Democrats Francis Oppler 962 38.7 +3.5
Conservative Katherine Eccles64425.9+11.1
Labour Heather Robbins35714.3−1.9
UKIP Chloe Watson2279.1−24.7
Independent Steve Goodheart2168.7+8.7
Green Conrad Meagher833.3+3.3
Majority31812.8+11.4
Turnout 2,48925.9+1.4
Liberal Democrats hold Swing
Bognor Regis West and Aldwick
PartyCandidateVotes%±%
Conservative Ashvinkumar Patel 1,715 47.9 +11.5
Liberal Democrats Paul Wells1,08930.4+3.0
Labour Alison Sharples3359.4+3.6
UKIP Matilda Watson2988.3−22.1
Green Susan Livett1464.1+4.1
Majority62617.5+11.5
Turnout 3,58336.0−0.1
Conservative hold Swing
East Preston and Ferring
PartyCandidateVotes%±%
Conservative Roger Elkins 2,994 72.0 +22.3
Labour Rachel Keys47411.4−3.0
Liberal Democrats John Richards42710.3+5.2
UKIP Richard Setford2626.3−24.9
Majority2,52060.6+42.5
Turnout 4,15741.2+4.6
Conservative hold Swing
Felpham
PartyCandidateVotes%±%
Conservative Hilary Flynn 1,846 64.9 +31.1
Independent Graham Jones42314.9+14.9
Labour Martin Eaves2418.5+3.0
Liberal Democrats Alan Gale2318.1+4.9
Green Nathan Meagher1043.7+3.7
Majority1,42350
Turnout 2,84531.3−3.9
Conservative gain from UKIP Swing
Fontwell
PartyCandidateVotes%±%
Conservative Derek Whittington 1,890 63.7 +19.4
Liberal Democrats Barbara Roberts30310.2−2.5
Green Isabel Thurston30310.2+10.2
Labour Roger Nash2478.3+1.6
UKIP Patricia Wales2247.6−26.6
Majority1,58753.5+43.4
Turnout 2,96732.1+2.5
Conservative hold Swing
Littlehampton East
PartyCandidateVotes%±%
Liberal Democrats James Walsh 1,439 44.8 +5.7
Conservative Stephen Haymes1,30240.5+13.2
Labour Maralyn May35611.1+3.5
Green Nathan Wyatt1193.7+3.7
Majority1374.3−7.5
Turnout 3,21632.5+0.4
Liberal Democrats hold Swing
Littlehampton Town
PartyCandidateVotes%±%
Liberal Democrats Ian Buckland 1,142 39.6 +9.0
Conservative David Britton92432.1+16.0
Labour Co-op Alan Butcher60721.1−0.4
Green David Jones1414.9+4.9
Independent Joby Akira692.4+2.4
Majority2187.5+3.7
Turnout 2,88329.4+1.7
Liberal Democrats hold Swing
Middleton
PartyCandidateVotes%±%
Conservative Jacqueline Pendleton 1,961 65.8 +24.6
Labour Linda Shepperd2568.6−1.4
Liberal Democrats Kenton Batley2378.0+0.8
UKIP Yusuf Ali1966.6−37.6
Independent Derek Ambler1796.0+6.0
Green Sarah Rands1535.1+5.1
Majority1,70557.2
Turnout 2,98233.9+2.4
Conservative gain from UKIP Swing +31.1
Nyetimber
PartyCandidateVotes%±%
Conservative Anita Hall 1,996 57.5 +23.1
UKIP Michael Warden62317.9−31.0
Liberal Democrats Brooke Olsen36310.5+3.9
Labour Jan Cosgrove2808.1−2.0
Green Carol Birch2116.1+6.1
Majority1,37339.6
Turnout 3,47337.3+4.3
Conservative gain from UKIP Swing +27.1
Rustington
PartyCandidateVotes%±%
Liberal Democrats Daniel Purchase 1,970 46.0 +37.3
Conservative Graham Tyler1,85343.3−2.6
Labour Nigel Stapley2375.5−4.5
UKIP Susan Waghorn2205.1−30.3
Majority1172.7
Turnout 4,28044.1+8.8
Liberal Democrats gain from Conservative Swing +20.0

Chichester

Bourne
PartyCandidateVotes%±%
Conservative Viral Parikh 1,357 40.2 +2.3
UKIP Sandra James86525.6−15.0
Liberal Democrats Rachel Keys65919.5+7.7
Labour Jane Towers2647.8−1.9
Green Ann Stewart2346.9+6.9
Majority49214.6
Turnout 3,37935.3+3.5
Conservative gain from UKIP Swing +8.7
Chichester East
PartyCandidateVotes%±%
Conservative Simon Oakley 1,138 47.7 +12.7
Liberal Democrats John Turbefield69229.0+3.0
Labour Mark Farwell35414.8+1.1
Green Polly Gaskin2048.5+8.5
Majority44618.7+9.7
Turnout 2,38827.6+3.2
Conservative hold Swing
Chichester North
PartyCandidateVotes%±%
Conservative Jeremy Hunt 1,946 56.0 +6.2
Liberal Democrats Bethan Norrell74521.5+5.3
Labour Kevin Hughes3038.7−1.8
Green Sam Pickford2396.9+6.9
UKIP Michael Mason1504.3−19.2
Independent Joseph Brookes-Harmer902.6+2.6
Majority1,20134.5+8.2
Turnout 3,47338.0+6.1
Conservative hold Swing
Chichester South
PartyCandidateVotes%±%
Conservative Jamie Fitzjohn 1,630 47.7 +7.6
Green Sarah Sharp94427.6+27.6
Liberal Democrats Craig Gershater55016.1−3.8
Labour John Ball2928.6−5.0
Majority68620.1+6.3
Turnout 3,41635.4+7.8
Conservative hold Swing
Chichester West
PartyCandidateVotes%±%
Conservative Louise Goldsmith 2,185 55.4 +0.8
Liberal Democrats Adrian Moss1,04626.5+15.6
Labour James Hobson2797.1−3.4
Green Lynne Waylen2426.1+6.1
UKIP Bernard Smith1734.4−18.7
PatriaAndrew Emerson210.5−0.3
Majority1,13928.9−2.6
Turnout 3,94641.1+ 8.9
Conservative hold Swing
Midhurst
PartyCandidateVotes%±%
Liberal Democrats Kate O’Kelly 1,263 34.8 +27.6
Conservative Alan Sutton1,21433.4+6.5
Independent Gordon McAra1,04028.6−2.8
Green Philip Amber1143.1+3.1
Majority491.4
Turnout 3,63141.9+10.9
Liberal Democrats gain from Independent Swing +15.2
Petworth
PartyCandidateVotes%±%
Conservative Janet Duncton 2,568 74.3 +19.5
Liberal Democrats Natalie Hume59217.1+4.4
UKIP Jeannie Dunning1664.8−21.2
Independent Andrew Young1303.8+3.8
Majority1,97657.2+28.4
Turnout 3,45635.8+ 4.1
Conservative hold Swing
Rother Valley
PartyCandidateVotes%±%
Conservative David Bradford 2,076 69.5
Liberal Democrats David Hares61720.7
Labour John Smith2949.8
Majority1,45948.8
Turnout 2,98735.0
Conservative win (new seat)
Selsey
PartyCandidateVotes%±%
Conservative Carol Purnell 1,480 51.4 +9.8
Independent Donna Johnson78427.3+27.3
UKIP Andrew Moncreiff2277.9−37.9
Labour Donna Gabriel2107.3−5.4
Liberal Democrats Simon Scotland973.4+3.4
Green John Cluley792.8+2.8
Majority69624.1
Turnout 2,87733.2+3.3
Conservative gain from UKIP Swing +23.9
The Witterings
PartyCandidateVotes%±%
Conservative Pieter Montyn 2,242 68.5 +17.0
Liberal Democrats Jane Scotland33910.4+4.3
Labour Joe O’Sullivan2828.6−0.1
UKIP Patricia Hunt2587.9−25.8
Green Stephanie Can1544.7+4.7
Majority1,90358.1+40.3
Turnout 3,27538.8+9.0
Conservative hold Swing

Crawley

Bewbush and Ifield West
PartyCandidateVotes%±%
Labour Chris Oxlade 1,040 45.2 −3.4
Conservative Duncan Peck80435.0+15.2
UKIP Christopher Brown23610.3−15.5
Liberal Democrats Sarah Smith1215.3+1.6
Green Martin Kail753.3+3.3
Justice Arshad Khan231.0−1.1
Majority23610.2−12.6
Turnout 2,29925.5+ 3.0
Labour hold Swing
Broadfield
PartyCandidateVotes%±%
Labour Brian Quinn 1,310 54.9 +4.4
Conservative Irshad Jalaldeen66227.7+4.7
UKIP George Bird26711.2−11.0
Green Charlotte Franco763.2+3.2
Liberal Democrats Stephen Tall733.1+0.7
Majority64827.2−0.3
Turnout 2,38826.5+3.2
Labour hold Swing
Langley Green & Ifield East
PartyCandidateVotes%±%
Labour Brenda Smith 1,343 48.3
Conservative Brenda Burgess1,01236.4
UKIP Sharon Kennett2027.3
Liberal Democrats Mike Sargent1374.9
Green Ben Fletcher893.2
Majority33111.9
Turnout 2,78329.7
Labour win (new seat)
Maidenbower & Worth
PartyCandidateVotes%±%
Conservative Bob Lanzer 1,962 65.1
Labour Peter Smith54017.9
Liberal Democrats Paul Cummings2929.7
UKIP Leonard Elphick1324.4
Green Daniel Fletcher872.9
Majority1,42247.2
Turnout 3,01334.2
Conservative win (new seat)
Northgate & West Green
PartyCandidateVotes%±%
Labour Sue Mullins 1,196 49.4
Conservative Ian Pendlington85235.2
UKIP Kevin Williams1546.4
Liberal Democrats Marko Scepanovic1205.0
Green Sam Wiltshire1004.1
Majority34414.2
Turnout 2,42230.2
Labour win (new seat)
Pound Hill
PartyCandidateVotes%±%
Conservative Richard Burrett 1,435 66.0
Labour Tahira Rana41619.1
Liberal Democrats Valerie Spooner1557.1
Green Daniel Elliot924.2
UKIP Janet Setford-Thompson753.5
Majority1,01946.9
Turnout 2,17233.1
Conservative win (new seat)
Southgate and Gossops Green
PartyCandidateVotes%±%
Labour Michael Jones 1,550 44.9
Conservative Kim Jaggard1,52744.2
UKIP Neil Setford-Thompson2196.3
Green Richard Kail1584.6
Majority230.7
Turnout 3,45335.4
Labour win (new seat)
Three Bridges
PartyCandidateVotes%±%
Conservative Charles Petts 1,303 45.0
Labour Julian Charatan1,15733.9
Liberal Democrats David Anderson1645.7
UKIP Martin Rann1555.3
Green Danielle Kail1194.1
Majority14611.1
Turnout 2,89834.7
Conservative win (new seat)
Tilgate and Furnace Green
PartyCandidateVotes%±%
Conservative Duncan Crow 1,934 58.1 +13.8
Labour Raj Sharma95528.7−3.2
UKIP Allan Griffiths1875.6−10.9
Liberal Democrats Kevin Osborne1705.1+3.2
Green Derek Hardman812.4−1.4
Majority97929.4+17.0
Turnout 3,32837.6+0.3
Conservative hold Swing

Horsham

Billingshurst
PartyCandidateVotes%±%
Conservative Amanda Jupp 1,898 63.3 +20.5
Liberal Democrats Richard Greenwood54518.2+8.6
Labour Robert Brown2839.4+0.7
UKIP Graham Harper2719.0−29.8
Majority1,35345.1+41.1
Turnout 2,99732.5+4.9
Conservative hold Swing
Bramber Castle
PartyCandidateVotes%±%
Conservative David Barling 1,849 53.8 +11.5
Liberal Democrats Ross Wellby88625.8−1.3
Labour Simon Birnstingl3369.8+0.6
Green Jo Prior2637.6+7.6
UKIP Ivan Hunter1063.1−18.3
Majority96328.012.8
Turnout 3,44037.9+3.7
Conservative hold Swing
Broadbridge
PartyCandidateVotes%±%
Conservative Christian Mitchell 1,673 57.9
Liberal Democrats Matthew Gaffar64422.3
Labour Cameron McGillivray2207.6
Green Catherine Ross1846.4
UKIP Patrick Dearsley1685.8
Majority1,02935.6
Turnout 2,88932.2
Conservative win (new seat)
Henfield
PartyCandidateVotes%±%
Conservative Lionel Barling 2,051 70.4 +19.0
Liberal Democrats David Boyle47116.2+5.7
Labour Helen Wright39113.4+5.0
Majority1,58054.2+32.6
Turnout 2,91334.4+ 5.5
Conservative hold Swing
Holbrook
PartyCandidateVotes%±%
Conservative Peter Catchpole 1,973 62.9 +16.7
Liberal Democrats Warwick Hellawell65320.8+2.6
Labour Raymond Chapman31410.0−0.2
Something New James Smith1996.3+6.3
Majority1,32042.1+21.2
Turnout 3,13936.3+5.9
Conservative hold Swing
Horsham East
PartyCandidateVotes%±%
Conservative Andrew Baldwin 1,709 48.4
Liberal Democrats Frances Haigh1,16933.1
Labour Ian Nicol2938.3
UKIP Mike Rowlands2156.1
Green Ferial Mactavish1444.1
Majority54015.3
Turnout 3,56039.8
Conservative win (new seat)
Horsham Hurst
PartyCandidateVotes%±%
Liberal Democrats Nigel Dennis 1,909 52.7 +8.3
Conservative Alan Britten1,16032.0+7.4
Labour Carol Hayton43011.9+0.3
UKIP Robin Monk1213.3−16.1
Majority74920.7+0.9
Turnout 3,62042.3+8.1
Liberal Democrats hold Swing
Horsham Riverside
PartyCandidateVotes%±%
Liberal Democrats Morwen Millson 1,320 43.6 +4.6
Conservative Ross Dye1,11936.9+11.6
Labour David Hide31810.5+1.6
UKIP Ray Toots1765.8−17.2
Peace Jim Duggan973.2−0.6
Majority2016.7−7.0
Turnout 3,03035.9+3.1
Liberal Democrats hold Swing
Pulborough
PartyCandidateVotes%±%
Conservative Pat Arculus 2,317 65.7 +22.0
Liberal Democrats Samuel Hancock61017.3+11.8
Labour Jane Mote3389.6+4.6
UKIP Liz Wallace2607.4−29.3
Majority1,70748.4+41.4
Turnout 3,52636.9+4.2
Conservative hold Swing
Southwater & Nuthurst Division
PartyCandidateVotes%±%
Conservative Nigel Jupp 1,574 55.1 +13.7
Liberal Democrats Bob Wheatcroft72025.2+9.1
Labour Kevin O'Sullivan1956.8+0.1
Green Peter Shaw1936.8+6.8
UKIP Gloria Eveleigh1776.2−29.6
Majority85429.9+24.3
Turnout 2,85930.3−0.1
Conservative hold Swing
St Leonards Forest
PartyCandidateVotes%±%
Conservative Liz Kitchen 1,179 62.1
Liberal Democrats Anthony Bevis33317.5
Labour Rosalind Hillman19610.3
UKIP Raymond Butler19110.1
Majority84644.6
Turnout 1,89930.4
Conservative win (new seat)
Storrington
PartyCandidateVotes%±%
Conservative Paul Marshall 2,389 62.0 +14.1
Liberal Democrats Steve Holbrook78220.3+6.2
Labour Caroline Fife3799.8+9.8
UKIP Peter Grace3027.8−30.2
Majority1,60741.7+31.8
Turnout 3,85238.0+4.9
Conservative hold Swing

Mid Sussex

Burgess Hill East
PartyCandidateVotes%±%
Conservative Anne Jones 1,440 41.2 +7.3
Liberal Democrats Roger Cartwright1,06030.4+12.3
Labour Pamela Haigh37110.6−6.4
Independent Scott McCarthy2878.2+8.2
UKIP Chris French1955.6−19.9
Green Matthew Cornish1394.0−1.6
Majority38010.8+2.4
Turnout 3,49237.5+2.5
Conservative hold Swing
Burgess Hill North
PartyCandidateVotes%±%
Conservative Andrew Barrett-Miles 1,359 40.2
Independent Peter Chapman81724.1
Liberal Democrats Lee Gibbs47614.1
Labour Simon Hayward46313.7
UKIP Timothy Cooper1444.3
Green Anne Eves1253.7
Majority54216.1
Turnout 3,38434.2
Conservative win (new seat)
Cuckfield and Lucastes
PartyCandidateVotes%±%
Conservative Pete Bradbury 1,641 57.2 +8.6
Liberal Democrats Stephen Blanch71124.8+7.0
Labour Sarah Moss28610.0−1.4
Green Catherine Edminson2298.0+8.0
Majority93032.4+6.0
Turnout 2,86732.4−0.6
Conservative hold Swing
East Grinstead Meridian
PartyCandidateVotes%±%
Conservative Liz Bennett 1,524 65.1 +17.1
Labour Michael Miller29412.6+4.8
Liberal Democrats Susan Knight26111.2−3.5
Green James Symons1486.3+1.0
UKIP Ian Simcock1134.8−19.4
Majority1,23052.5+28.7
Turnout 2,34126.6+1.7
Conservative hold Swing
East Grinstead South and Ashurst Wood
PartyCandidateVotes%±%
Conservative Jacquie Russell 1,505 55.8 +12.0
Liberal Democrats Paul Johnson62623.2+4.3
Green Elaine Eichner2418.9+1.2
Labour David Wilbraham1957.2+0.7
UKIP Barry Noldart1294.8−18.3
Majority87932.6+11.9
Turnout 2,69629.5+2.0
Conservative hold Swing
Hassocks and Burgess Hill South
PartyCandidateVotes%±%
Liberal Democrats Kirsty Lord 1,545 38.9
Conservative Tudor Ellis1,52538.4
Labour Linda Taylor54913.8
UKIP Charles Burrell1824.6
Green Nicholas Dearden1754.4
Majority200.5
Turnout 3,97743.7
Liberal Democrats win (new seat)
Haywards Heath East
PartyCandidateVotes%±%
Conservative Stephen Hillier 1,317 51.5 +17.7
Labour William Blunden46018.0−3.6
Liberal Democrats Stephanie Inglesfield43817.1−1.1
UKIP Howard Burrell1937.6−18.8
Green Gillian Maher1475.8+5.8
Majority85733.5+27.1
Turnout 2,55530.4+0.7
Conservative hold Swing
Haywards Heath Town
PartyCandidateVotes%±%
Conservative Sujan Wickremaratchi 1,459 47.8 +11.9
Liberal Democrats Richard Bates99032.4+10.2
Labour Hilary Schan-Martyn44314.5−4.2
Green David Woolley1615.3+5.3
Majority46915.4+2.7
Turnout 3,05335.4+2.8
Conservative hold Swing
Hurstpierpoint & Bolney
PartyCandidateVotes%±%
Conservative Joy Dennis 1,821 49.7 +0.6
Liberal Democrats Alison Bennett98226.8+13.7
Labour Norina O'Hare39610.8+2.8
Green Mike Airey2807.6−3.4
UKIP Peter Hopgood1423.9−14.9
Monster Raving Loony Baron Thunderclap411.1+1.1
Majority83922.9−7.4
Turnout 3,66238.0+5.1
Conservative hold Swing
Imberdown
PartyCandidateVotes%±%
Conservative Heidi Brunsdon 1,476 47.8 +4.6
Independent Ian Gibson98832.0+32.0
Liberal Democrats Graham Knight2157.0−17.3
Labour Deborah Miles1886.1+6.1
UKIP Brian Bezzant1153.7−28.7
Green Justin Morgan1043.4+3.4
Majority48815.8+5.0
Turnout 3,08635.2+5.3
Conservative hold Swing
Lindfield and High Weald
PartyCandidateVotes%±%
Conservative Andrew Lea 2,233 58.5 +9.3
Liberal Democrats Anne-Marie Lucraft60415.8+7.3
Green Paul Brown49613.0−2.1
Labour Lisa Desbruslais3539.3+1.9
UKIP Eric Prior1293.4−16.5
Majority1,62942.7+13.4
Turnout 3,81738.5+3.5
Conservative hold Swing
Worth Forest
PartyCandidateVotes%±%
Conservative Bill Acraman 1,937 64.6 +20.5
Liberal Democrats Henry Fleming41613.9+7.7
Labour Susannah Brady2839.4−3.0
Green Darrin Green2137.1−0.2
UKIP Marielena Burrell1484.9−25.1
Majority1,52150.7+36.6
Turnout 2,99730.0+0.9
Conservative hold Swing

Worthing

Broadwater
PartyCandidateVotes%±%
Conservative Bryan Turner 1,290 42.0 +10.8
Labour Lorna Beaumont1,03533.7+18.0
Liberal Democrats John Aspey36511.9−13.7
Green Richard Battson1966.4+6.4
UKIP Christopher Gould1856.0−21.5
Majority2558.3+4.6
Turnout 3,07132.7+9.0
Conservative hold Swing
Cissbury
PartyCandidateVotes%±%
Conservative Elizabeth Sparkes 2,225 65.9 +24.0
Liberal Democrats Jackie Cranefield42912.7+5.0
Labour Margaret Howard35510.5+4.3
UKIP Adam Fitchett2076.1−32.9
Green Daniel Parsonage1594.7−0.5
Majority1,79653.2+50.3
Turnout 3,37538.3+6.3
Conservative hold Swing
Durrington & Salvington
PartyCandidateVotes%±%
Conservative Noel Atkins 1,553 51.1 +14.3
Liberal Democrats Hazel Thorpe62920.7+6.4
Labour Guy Chadwick39012.8+2.3
UKIP Mike Jelliss33110.9−27.5
Green Stephen Carleysmith1374.5+4.5
Majority92430.4
Turnout 3,04031.1+5.8
Conservative gain from UKIP Swing +20.9
Goring
PartyCandidateVotes%±%
Conservative Steve Waight 1,996 61.3 +19.3
Labour Rebecca Cooper45413.9+5.1
Liberal Democrats Antony Brown36811.3+3.9
UKIP Richard Bater2387.3−27.7
Green David Aherne2016.2−0.7
Majority1,54247.4+40.4
Turnout 3,25738.0+6.7
Conservative hold Swing
Northbrook
PartyCandidateVotes%±%
Conservative Sean McDonald 1,315 49.8 +18.5
Liberal Democrats Jamie Bennett51619.6-11.9
Labour Adrienne Davis36413.8+4.2
UKIP Mark Withers31011.7-12.4
Green Julian Warrick1345.1+1.6
Majority79930.2
Turnout 2,63929.4+3.1
Conservative gain from Liberal Democrats Swing +15.2
Tarring
PartyCandidateVotes%±%
Liberal Democrats Bob Smytherman 1,304 38.4 +5.3
Conservative Vino Vinojan1,18434.8+11.8
Labour David Lace50614.9+6.0
UKIP Adrian Price2296.7-20.6
Green Constantine de Goguel1775.2-2.5
Majority1203.6-2.2
Turnout 3,40134.4+8.4
Liberal Democrats hold Swing
Worthing East
PartyCandidateVotes%±%
Conservative Roger Oakley 1,210 38.4 +8.1
Labour Mike Barrett1,18237.5+17.6
Liberal Democrats Yvonne Leonard34110.8-13.5
Green Rosie Turner2146.8+6.8
UKIP Graham Adams2016.4-19.1
Majority280.9-3.9
Turnout 3,14834.6+8.6
Conservative hold Swing
Worthing Pier
PartyCandidateVotes%±%
Conservative Michael Cloake 1,197 37.2 +8.1
Labour Jim Deen1,00031.1+18.7
Green James Doyle61819.2-3.4
Liberal Democrats Christine Brown2367.3-7.7
UKIP Sue Jelliss1665.2-15.7
Majority1976.1-0.4
Turnout 3,21833.8+9.3
Conservative hold Swing
Worthing West
PartyCandidateVotes%±%
Conservative Paul High 1,605 51.6 +12.9
Labour Richard Mulholland68121.9+10.7
Liberal Democrats Keith Sunderland37212.0+2.8
Green Caroline Ponto2648.5-0.3
UKIP Trevor England1896.1-26.0
Majority92429.7+23.1
Turnout 3,13135.2+8.6
Conservative hold Swing

Related Research Articles

<span class="mw-page-title-main">Wimbledon (UK Parliament constituency)</span> Parliamentary constituency in the United Kingdom, 1885 onwards

Wimbledon is a constituency in Greater London represented in the House of Commons of the UK Parliament. Since 2005, the seat has been held by Stephen Hammond of the Conservative Party.

The district of Epping Forest is in the county of Essex in England. It was created on 1 April 1974, following the merger of Epping Urban District, Chigwell Urban District, Waltham Holy Cross Urban District, and part of Epping and Ongar Rural District.

Cornwall Council in England, UK, was established in 2009 and is elected every four years. From 1973 to 2005 elections were for Cornwall County Council, with the first election for the new unitary Cornwall Council held in June 2009. This election saw 123 members elected, replacing the previous 82 councillors on Cornwall County Council and the 249 on the six district and borough councils. In June 2013 the Local Government Boundary Commission for England announced a public consultation on its proposal that Cornwall Council should have 87 councillors in future.

One third of Crawley Borough Council in West Sussex, England is elected each year, followed by one year without election. Since the last boundary changes in 2019, 36 councillors have been elected from 13 wards.

<span class="mw-page-title-main">1979 United Kingdom local elections</span>

Local elections were held in the United Kingdom on 3 May 1979. The results provided some source of comfort to the Labour Party, who recovered some lost ground from local election reversals in previous years, despite losing the general election to the Conservative Party on the same day. The Liberals also gained councillors and a council.

Milton Keynes City Council is the local authority for the City of Milton Keynes, a unitary authority in Buckinghamshire, England. Until 1 April 1997 it was a non-metropolitan district.

<span class="mw-page-title-main">2013 West Sussex County Council election</span> 2013 UK local government election

The West Sussex County Council election, 2013 took place on 2 May 2013, as part of the 2013 United Kingdom local elections. All 71 electoral divisions were up for election, which returned one county councillor each by first-past-the-post voting for a four-year term of office. At this election, the Conservative Party was seeking to retain overall control of the council, and the Liberal Democrats to maintain their position as the main opposition party.

<span class="mw-page-title-main">2013 East Sussex County Council election</span> 2013 UK local government election

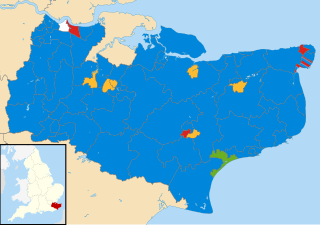
The East Sussex County Council election, 2013 took place on 2 May 2013 as part of the 2013 United Kingdom local elections. All 49 councillors of East Sussex County Council were elected from 44 electoral divisions, which return either one or two councillors each by first-past-the-post voting for a four-year term of office. The electoral divisions were the same as those used at the previous election in 2009. No elections were held in Brighton and Hove, which is a unitary authority outside the area covered by the County Council.

<span class="mw-page-title-main">2013 Surrey County Council election</span> 2013 UK local government election

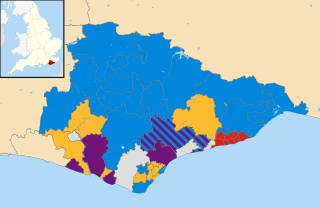
The Surrey County Council election, 2013 took place on 2 May 2013 as part of the 2013 United Kingdom local elections. 81 electoral divisions returned one county councillor each by first-past-the-post voting for a four-year term of office. Following a review, new electoral division boundaries were introduced for this election, increasing the number of councillors from 80 to 81.

<span class="mw-page-title-main">2017 United Kingdom local elections</span>

The 2017 United Kingdom local elections were held on Thursday 4 May 2017. Local elections were held across Great Britain, with elections to 35 English local authorities and all councils in Scotland and Wales.

<span class="mw-page-title-main">2017 Nottinghamshire County Council election</span> 2017 election of all 66 councillors to Nottinghamshire County Council

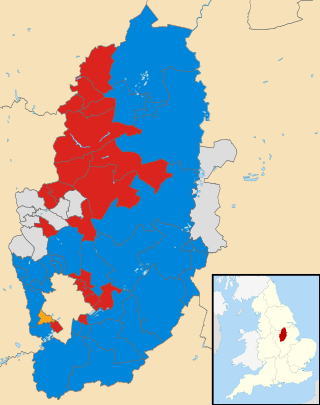
The 2017 Nottinghamshire County Council election took place on 4 May 2017 as part of the 2017 local elections in the United Kingdom. The whole council of 66 councillors was elected for a four-year term spanning 56 electoral divisions, a minority of which return two councillors. The voting system used is first-past-the-post.

<span class="mw-page-title-main">2017 Cambridgeshire County Council election</span> 2017 UK local government election

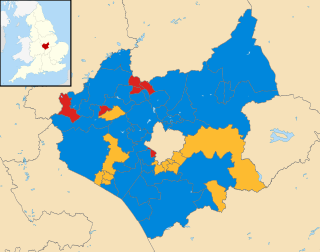
The 2017 Cambridgeshire County Council election was held on 4 May 2017 as part of the 2017 local elections in the United Kingdom. All 61 councillors were elected from 59 electoral divisions, which returned either one or two county councillors each by first-past-the-post voting for a four-year term of office.

<span class="mw-page-title-main">2017 East Sussex County Council election</span> Election

The 2017 East Sussex County Council election took place on 4 May 2017 as part of the 2017 local elections in the United Kingdom. All councillors were to be elected from electoral divisions by first-past-the-post voting for a four-year term of office.

<span class="mw-page-title-main">2017 Kent County Council election</span> 2017 UK local government election

The 2017 Kent County Council election was held on 4 May 2017 as part of the 2017 local elections in the United Kingdom. All 81 councillors were elected from 72 electoral divisions, each of which returned either one or two county councillors by first-past-the-post voting for a four-year term of office. The Conservative Party retained control. UKIP, previously the second-largest party on the council, lost all their seats.

<span class="mw-page-title-main">2017 Leicestershire County Council election</span> 2017 UK local government election

The 2017 Leicestershire County Council election took place on 4 May 2017 as part of the 2017 local elections in the United Kingdom. All councillors were elected from electoral divisions by first-past-the-post voting for a four-year term of office.

<span class="mw-page-title-main">2017 Lincolnshire County Council election</span> 2017 UK local government election

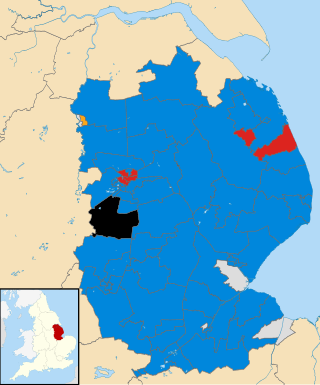
The 2017 Lincolnshire County Council election took place in non-metropolitan Lincolnshire on 4 May 2017 as part of the 2017 local elections in the United Kingdom. A total of 70 councillors were elected across the seven non-metropolitan districts that make up the administrative county of Lincolnshire from 70 single member electoral divisions by first-past-the-post voting for a four-year term of office. The election did not include North Lincolnshire and North East Lincolnshire as they are separate unitary authorities.

<span class="mw-page-title-main">2017 Warwickshire County Council election</span> 2017 UK local government election

The 2017 Warwickshire County Council election took place as part of the 2017 local elections in the UK. All 57 councillors were elected for single-member electoral divisions for a four-year term. The voting system used was first-past-the-post.

<span class="mw-page-title-main">2019 United Kingdom local elections</span> Elections to local councils and mayoralties

The 2019 United Kingdom local elections took place on Thursday 2 May 2019, with 248 English local councils, six directly elected mayors in England, and all 11 local councils in Northern Ireland being contested.

<span class="mw-page-title-main">2021 United Kingdom local elections</span> Elections to local councils and mayoralties

The 2021 United Kingdom local elections were held on Thursday 6 May 2021. More than 145 English local councils, around 5,000 councillor seats, thirteen directly elected mayors in England, and 39 police and crime commissioners in England and Wales were contested. On the same day, the 2021 Hartlepool by-election took place, and there were also elections to the Scottish Parliament, Senedd and London Assembly, the last in conjunction with the London mayoral election.

<span class="mw-page-title-main">2022 Rochdale Metropolitan Borough Council election</span> 2022 local election in Rochdale

The 2022 Rochdale Metropolitan Borough Council election took place as of 5 May 2022. Due to boundary changes, all 60 councillors were elected at the same time. The election took place alongside other local elections across the United Kingdom.

References

  1. "Upcoming elections & referendums". Electoral Commission. Archived from the original on 5 May 2018. Retrieved 16 September 2016.
  2. "West Sussex County Council". Local Government Boundary Commission for England. Retrieved 16 September 2016.
  3. "West Sussex County Council election results 2017". West Sussex County Council. 5 May 2017. Retrieved 10 May 2017.