Results maps
 2009 results map
 2013 results map
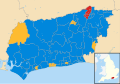 2017 results map
 2021 results map
West Sussex County Council in England is elected every four years.
| Overall control | Conservative | Lib Dems | Labour | UKIP | Green | Local Alliance | Independent | ||||||||
| 2021 | Con | 48 | 10 | 9 | - | 1 | 1 | 1 | |||||||
| 2017 | Con | 56 | 9 | 5 | - | - | - | - | |||||||
| 2013 | Con | 46 | 8 | 6 | 10 | - | - | 1 | |||||||
| 2009 | Con | 48 | 21 | 2 | - | - | - | - | |||||||
| 2005 | Con | 46 | 17 | 7 | - | - | - | - | |||||||
| 2001 | Con | 42 | 18 | 11 | - | - | - | - | |||||||
| 1997 | Con | 37 | 24 | 9 | - | - | - | 1 | |||||||


| Party | Candidate | Votes | % | ±% | |
|---|---|---|---|---|---|
| Labour | 1,283 | 79.8 | |||
| Conservative | 229 | 14.2 | |||
| Liberal Democrats | 96 | 6.0 | |||
| Majority | 1,054 | 65.6 | |||
| Turnout | 1,608 | 26.7 | |||
| Labour hold | Swing | ||||
| Party | Candidate | Votes | % | ±% | |
|---|---|---|---|---|---|
| Liberal Democrats | 1,077 | 50.2 | +4.5 | ||
| Conservative | 750 | 34.9 | -0.5 | ||
| Labour | 319 | 14.9 | -3.9 | ||
| Majority | 327 | 15.3 | |||
| Turnout | 2,146 | ||||
| Liberal Democrats hold | Swing | ||||
| Party | Candidate | Votes | % | ±% | |
|---|---|---|---|---|---|
| Conservative | Michael Willett | 1,297 | 44.0 | +1.6 | |
| Liberal Democrats | Derek Deedman | 1,040 | 35.3 | -12.0 | |
| Labour | John Ridley | 480 | 16.3 | +6.1 | |
| Independent | Bernard Durnford | 132 | 4.5 | +4.5 | |
| Majority | 257 | 8.7 | |||
| Turnout | 2,949 | ||||
| Conservative gain from Liberal Democrats | Swing | ||||
| Party | Candidate | Votes | % | ±% | |
|---|---|---|---|---|---|
| Labour | 830 | 50.7 | -1.1 | ||
| Conservative | 635 | 38.8 | +4.3 | ||
| Liberal Democrats | 171 | 10.4 | +0.0 | ||
| Majority | 195 | 11.9 | |||
| Turnout | 1,636 | 23.1 | |||
| Labour hold | Swing | ||||
| Party | Candidate | Votes | % | ±% | |
|---|---|---|---|---|---|
| Liberal Democrats | Patricia Webster | 1,027 | 51.8 | +22.6 | |
| Conservative | Peter Jones | 954 | 48.2 | -4.0 | |
| Majority | 73 | 3.6 | |||
| Turnout | 1,981 | 26.0 | |||
| Liberal Democrats gain from Conservative | Swing | ||||
| Party | Candidate | Votes | % | ±% | |
|---|---|---|---|---|---|
| Conservative | Robert Dunn | 1,145 | 59.9 | +13.2 | |
| Liberal Democrats | Mark O'Keeffe | 420 | 22.0 | -2.0 | |
| Labour | Adrienne Lowe | 346 | 18.1 | -11.1 | |
| Majority | 725 | 37.9 | |||
| Turnout | 1,911 | 20.9 | |||
| Conservative hold | Swing | ||||
| Party | Candidate | Votes | % | ±% | |
|---|---|---|---|---|---|
| Liberal Democrats | Anthony Hull | 1,652 | 44.9 | -1.9 | |
| Conservative | John Charles | 1,575 | 42.8 | +4.5 | |
| Labour | Richard Wilson | 454 | 12.3 | -2.6 | |
| Majority | 77 | 2.1 | |||
| Turnout | 3,681 | 42.9 | |||
| Liberal Democrats hold | Swing | ||||
| Party | Candidate | Votes | % | ±% | |
|---|---|---|---|---|---|
| Conservative | Deborah Urquhart | 1,500 | 75.6 | +25.4 | |
| Liberal Democrats | Trevor Richards | 334 | 16.8 | -21.0 | |
| Labour | James Field | 149 | 7.5 | +7.5 | |
| Majority | 1,166 | 58.8 | |||
| Turnout | 1,983 | 25.8 | |||
| Conservative hold | Swing | ||||
| Party | Candidate | Votes | % | ±% | |
|---|---|---|---|---|---|
| Conservative | Janet Mockridge | 907 | 55.5 | +15.4 | |
| Labour | Andrew Bray | 316 | 19.4 | -9.6 | |
| Liberal Democrats | James Doyle | 314 | 19.2 | -0.3 | |
| Green | Susan Board | 96 | 5.9 | +0.9 | |
| Majority | 591 | 36.1 | |||
| Turnout | 1,633 | 21.0 | |||
| Conservative hold | Swing | ||||
| Party | Candidate | Votes | % | ±% | |
|---|---|---|---|---|---|
| Conservative | Peter Bradbury | 2,020 | 61.3 | +8.3 | |
| Liberal Democrats | Stephen Blanch | 1,274 | 38.7 | +7.4 | |
| Majority | 746 | 22.6 | |||
| Turnout | 3,358 | 45.41 | -27.39 | ||
| Conservative hold | Swing | ||||
| Party | Candidate | Votes | % | ±% | |
|---|---|---|---|---|---|
| Conservative | Chris Duncton | 1,437 | 72.0 | +17.8 | |
| Liberal Democrats | Raymond Cooper | 346 | 17.3 | =13.0 | |
| BNP | Andrew Emerson | 213 | 10.7 | +10.7 | |
| Majority | 1,091 | 54.7 | |||
| Turnout | 2,002 | 21.12 | -48.60 | ||
| Conservative hold | Swing | ||||
| Party | Candidate | Votes | % | ±% | |
|---|---|---|---|---|---|
| Conservative | John O'Brien | 2,878 | 48.2 | +3.7 | |
| Liberal Democrats | Catrin Ingham | 2,771 | 46.4 | +6.5 | |
| Independent | Robert Wall | 328 | 5.5 | N/A | |
| Majority | 107 | 1.8 | -1.8 | ||
| Turnout | 5,977 | 68.5 | +27.3 | ||
| Conservative hold | Swing | ||||
| Party | Candidate | Votes | % | ±% | |
|---|---|---|---|---|---|
| Conservative | Robert Lanzer | 1,036 | 64.4 | -7.9 | |
| Labour | Peter Smith | 417 | 26.0 | +12.0 | |
| Liberal Democrats | Sulu Pandya | 82 | 5.1 | -8.6 | |
| UKIP | John MacCanna | 61 | 3.8 | +3.8 | |
| Justice Party | Arshad Khan | 12 | 0.7 | +0.7 | |
| Majority | 619 | 38.5 | -19.8 | ||
| Turnout | 1,609 | ||||
| Conservative hold | Swing | -10.0 | |||
| Party | Candidate | Votes | % | ±% | |
|---|---|---|---|---|---|
| Conservative | John Cherry | 1,410 | 78.2 | +9.8 | |
| UKIP | Judith Fowler | 392 | 21.8 | N/A | |
| Majority | 1,018 | 56.0 | +13.9 | ||
| Turnout | 1,900 | 21.5 | -15.8 | ||
| Conservative hold | Swing | ||||
| Party | Candidate | Votes | % | ±% | |
|---|---|---|---|---|---|
| Conservative | Philip Circus | 1,037 | 45.9 | -2.0 | |
| UKIP | John Wallace | 729 | 32.2 | -7.8 | |
| Liberal Democrats | Nick Hopkinson | 364 | 16.1 | +2.0 | |
| Green | James Doyle | 131 | 5.8 | N/A | |
| Majority | 308 | 13.7 | +3.8 | ||
| Turnout | 2,261 | 22.5 | -10.6 | ||
| Conservative hold | Swing | +2.9 | |||
| Party | Candidate | Votes | % | ±% | |
|---|---|---|---|---|---|
| Conservative | Liz Kitchen | 868 | 58.3 | +3.3 | |
| UKIP | Geoff Stevens | 335 | 22.5 | -7.7 | |
| Green | Darrin Green | 119 | 8.0 | N/A | |
| Liberal Democrats | Tony Millson | 103 | 6.9 | -7.9 | |
| Labour | Carol Hayton | 63 | 4.4 | N/A | |
| Majority | 533 | 36.8 | +12..0 | ||
| Turnout | 1490 | 20.1 | -10.1 | ||
| Conservative hold | Swing | +5.5 | |||
| Party | Candidate | Votes | % | ±% | |
|---|---|---|---|---|---|
| Conservative | Stephen Hillier | 649 | 35.5 | +1.7 | |
| UKIP | Charles Burrell | 576 | 31.5 | +5.1 | |
| Labour | Richard Goddard | 346 | 18.9 | -2.7 | |
| Liberal Democrats | Anne Hall | 201 | 11.0 | -8.2 | |
| Green | Paul Brown | 55 | 3.0 | N/A | |
| Majority | 73 | 4.0 | -2.4 | ||
| Turnout | 1832 | 23.1 | -6.6 | ||
| Conservative hold | Swing | -1.2 | |||
| Party | Candidate | Votes | % | ±% | |
|---|---|---|---|---|---|
| Labour | Karen Sudan | 1,293 | 48.9 | ||
| Conservative | Jan Tarrant | 839 | 31.7 | ||
| Liberal Democrats | David Anderson | 268 | 10.1 | ||
| Green | Richard Kail | 246 | 9.3 | ||
| Majority | 454 | 17.2 | |||
| Turnout | 2,646 | 30.2 | |||
| Labour hold | Swing | ||||
| Party | Candidate | Votes | % | ±% | |
|---|---|---|---|---|---|
| Conservative | Brenda Burgess | 1,102 | 51.7 | ||
| Labour | Angela Malik | 628 | 29.5 | ||
| Liberal Democrats | David Anderson | 257 | 12.1 | ||
| Green | Danielle Kail | 136 | 6.4 | ||
| Justice Party | Arshad Khan | 9 | 0.4 | ||
| Majority | 474 | 22.2 | |||
| Turnout | 2,132 | 25.2 | |||
| Conservative hold | Swing | ||||
| Party | Candidate | Votes | % | ±% | |
|---|---|---|---|---|---|
| Conservative | Mike Magill | 1,368 | 48.9 | ||
| Liberal Democrats | Andrew Kerry-Bedell | 1,009 | 36.0 | ||
| Green | Michael Neville | 250 | 8.9 | ||
| Labour | Jane Towers | 161 | 5.8 | ||
| Patria | Andrew Emerson | 12 | 0.4 | ||
| Majority | 359 | 12.8 | |||
| Turnout | 2,800 | 28.8 | |||
| Conservative hold | Swing | ||||
| Party | Candidate | Votes | % | ±% | |
|---|---|---|---|---|---|
| Liberal Democrats | Andrew Kerry-Bedell | 1,180 | 51.8 | +22.8 | |
| Conservative | Bob Hayes | 893 | 39.2 | -11.7 | |
| Green | Ann Stewart | 178 | 7.8 | -3.1 | |
| Labour | Alan Butcher | 25 | 1.1 | -8.1 | |
| Majority | 287 | 12.6 | |||
| Turnout | 2,276 | ||||
| Liberal Democrats gain from Conservative | Swing | ||||
| Party | Candidate | Votes | % | ±% | |
|---|---|---|---|---|---|
| Labour | Graham McKnight | 1,262 | 52.0 | +5.6 | |
| Conservative | Michael Cloake | 795 | 32.8 | -6.3 | |
| Liberal Democrats | Hazel Thorpe | 235 | 9.7 | +5.4 | |
| Green | Jo Paul | 133 | 5.5 | -1.7 | |
| Majority | 467 | 19.3 | |||
| Turnout | 2,425 | ||||
| Labour hold | Swing | ||||
| Party | Candidate | Votes | % | ±% | |
|---|---|---|---|---|---|
| Independent | Jaine Wild | 803 | 43.4 | +43.4 | |
| Conservative | David Darling | 733 | 39.6 | -12.8 | |
| Labour | David Meagher | 217 | 11.7 | +3.5 | |
| Independent | Richard Parker | 99 | 5.3 | -14.8 | |
| Majority | 70 | 3.8 | |||
| Turnout | 1,852 | ||||
| Independent gain from Conservative | Swing | ||||
| Party | Candidate | Votes | % | ±% | |
|---|---|---|---|---|---|
| Conservative | John Dabell | 1,064 | 43.6 | -10.8 | |
| Independent | Norman Mockford | 467 | 19.1 | +6.4 | |
| Liberal Democrats | Andrew Lane | 365 | 14.9 | +2.5 | |
| Labour | Timothy Cornell | 340 | 13.9 | +3.2 | |
| Green | Alex Langridge | 207 | 8.5 | -1.3 | |
| Majority | 597 | 24.4 | |||
| Turnout | 2,443 | ||||
| Conservative hold | Swing | ||||
Buckinghamshire County Council in England was elected every four years from 1973 until 2020.
Oxfordshire County Council is elected every four years.
Torbay Council is the local authority for the unitary authority of Torbay in Devon, England. Until 1 April 1998 it was a non-metropolitan district. From 2005 to 2019 it had a directly elected mayor. The council is elected every four years.
Half of Adur District Council in West Sussex, England is elected every two years. Until 2003, the council was elected by thirds. Since the last boundary changes in 2004, 29 councillors have been elected from 14 wards.
Charnwood Borough Council elections are held every four years. Charnwood Borough Council is the local authority for the non-metropolitan district of Charnwood in Leicestershire, England. Since the last boundary changes in 2023 the council has comprised 52 councillors, representing 24 wards, with each ward electing one, two or three councillors.
One third of Crawley Borough Council in West Sussex, England is elected each year, followed by one year without election. Since the last boundary changes in 2019, 36 councillors have been elected from 13 wards.
Cumbria County Council in England was elected every four years between 1973 and 2017. Since the last boundary changes in 2013, 84 councillors were elected from 84 wards for the last council before abolition in 2023.
Derbyshire County Council elections are held every four years. Derbyshire County Council is the upper-tier authority for the non-metropolitan county of Derbyshire in England. Since the last boundary changes in 2013, 64 councillors have been elected from 61 electoral divisions.
Durham County Council elections are held every four years. Durham County Council is the local authority for the unitary authority of County Durham. The county council was first created in 1889 as an upper-tier authority, had its powers and territory reformed in 1974 under the Local Government Act 1972, and became a unitary authority in 2009, when the lower-tier district councils in the area were abolished. Since becoming a unitary authority, 126 councillors have been elected from 63 wards.
Lincolnshire County Council in England is elected every four years.
Norfolk County Council in England is elected every four years. Since the last boundary changes in 2005, 84 councillors have been elected from 84 wards.

South Ribble Borough Council elections are held every four years. South Ribble Borough Council is the local authority for the non-metropolitan district of South Ribble in Lancashire, England. Since the last boundary changes in 2015, 50 councillors have been elected from 23 wards. The next borough council elections are due to take place in 2027 as part of the wider 2027 United Kingdom local elections.
North Norfolk District Council in Norfolk, England is elected every four years.
Mid Sussex District Council is elected every four years.
Dover District Council is the local authority for the Dover District in Kent, England. The council is elected every four years.
West Devon Borough Council in Devon, England is elected every four years. Since the last boundary changes in 2015, 31 councillors have been elected from 18 wards.
Nottinghamshire County Council elections are held every four years. Nottinghamshire County Council is the upper-tier authority for the non-metropolitan county of Nottinghamshire in England. Since the last boundary changes in 2017, 66 county councillors have been elected from 56 electoral divisions.
Northamptonshire County Council was the county council for Northamptonshire in England. It was initially created in 1889 under the Local Government Act 1888, with its functions being substantially reformed in 1974 under the Local Government Act 1972. The council was abolished in 2021, with the area split into North Northamptonshire and West Northamptonshire. Elections to Northamptonshire County Council were held every four years.

Horsham District Council in West Sussex, England, is elected every four years.
North Yorkshire Council elections are generally held every four years. From 1974 until 2023 the council was called North Yorkshire County Council and it was an upper tier county council, with district-level functions being provided by the area's district councils. The districts were all abolished with effect from 1 April 2023, at which point the county council became a unitary authority, taking on the functions of the abolished district councils. The county council changed its name to North Yorkshire Council to coincide with the change in its powers.
| West Sussex CC | |
|---|---|
| Adur | |
| Arun | |
| Chichester | |
| Crawley | |
| Horsham | |
| Mid Sussex | |
| Worthing | |
| |