2009 West Sussex County Council election

Last updated

2009 West Sussex County Council election
Flag of West Sussex.svg
  2005 4 June 2009 2013  

All 71 seats to West Sussex County Council
36 seats needed for a majority
 First partySecond partyThird party
 
Party Conservative Liberal Democrats Labour
Seats won48212
Seat changeIncrease2.svg2Increase2.svg4Decrease2.svg5

West Sussex wards 2009.svg
Map showing the results of the 2009 West Sussex County Council elections.

Council control before election

Conservative

Council control after election

Conservative

The West Sussex County Council election, 2009 were elections to West Sussex County Council which took place on 4 June 2009, having been delayed from 7 May, in order to coincide with elections to the European Parliament.

Contents

The elections saw the Conservative Party retain overall control, having done so since 1997. On this occasion they gained two seats and saw their vote share increase by just over 5%. The Liberal Democrats strengthened their position as the main opposition party, gaining a net total of four seats, despite their own share of the vote falling by nearly 4%. The Labour Party lost five of the seven seats they had held before the election, and saw their vote fall by nearly 10%, broadly in line with their national decline. This decline saw the party fall to fourth place in the county in terms of the popular vote, being replaced in third by the UK Independence Party, who are likely to have benefited by voting being held alongside the European Parliament elections. [1]

Summary

West Sussex County Council election, 2009
PartySeatsGainsLossesNet gain/lossSeats %Votes %Votes+/−
  Conservative 4886+267.6148.40114,088+5.23%
  Liberal Democrats 217 [nb 1] 3+429.5828.9668,262-3.76%
  UKIP 00000.008.5520,152+5.57%
  Labour 205-52.828.4819,982-9.28%
  Green 00000.002.215,212-0.07%
  BNP 00000.002.014,742+1.81%
  Independent 00000.000.661,553-0.18%
  English Democrat 00000.000.611,446N/A
  Peace 00000.000.07159N/A
  Justice 00000.000.05121N/A
  1. Includes Horsham, Tanbridge and Broadbridge Heath, a new seat created as a result of a long public consultation held by the Local Government Boundary Commission for England, triggered by a level of natural malapportionment due to the variance in electorate threshold reached in at least 30% of wards.

Results by division

The elections were the first to be fought on new electoral divisions as recommended by the Boundary Committee for England following a review, carried out at the request of West Sussex County Council. The new arrangement of 71 single-member divisions replaced the 70 seats that were contested across 62 divisions in 2005. [2] The recommendations were accepted by the Electoral Commission in February 2009, who implemented the legal order authorising the change and allowing the new divisions to be used in these elections on 6 March 2009. [3] [4]

Adur

Kingston Buci
PartyCandidateVotes%±%
Conservative Paul Graysmark1,19845.8+8.9
UKIP Michael Henn55421.2+15.6
Labour Andrew Bray45217.3-11.7
Liberal Democrats Patricia Izod40915.7-7.8
Majority64424.6+16.7
Turnout 2,61335.1-26.8
Conservative hold Swing
Lancing
PartyCandidateVotes%±%
Conservative Angela Mills88034.4-3.0
Liberal Democrats Stephen Martin75329.4-1.2
UKIP David Bushell71027.8+20.8
Labour David Devoy2158.4-16.6
Majority1275.0-1.8
Turnout 2,55831.6-27.9
Conservative hold Swing
Saltings
PartyCandidateVotes%±%
Conservative Robert Dunn1,15438.1-5.2
UKIP Mike Mendoza 78125.8+21.1
Liberal Democrats Doris Martin45815.1-13.2
Green Stephen Barnes36512.1N/A
Labour Agnes Daniel2698.9-14.8
Majority37312.3-2.7
Turnout 3,02737.2-26.2
Conservative hold Swing
Shoreham
PartyCandidateVotes%±%
Conservative Brian Coomber1,45349.1+2.0
Green Moyra Martin48316.3+7.7
UKIP Brian Elliott39613.4+9.4
Liberal Democrats Cyril Cannings37012.5-8.6
Labour Richard Daniel2568.7-10.6
Majority97032.8+6.8
Turnout 2,95839.8-30.2
Conservative hold Swing
Sompting & North Lancing
PartyCandidateVotes%±%
Conservative David Simmons1,37645.3+5.3
UKIP Reuben Whiting74724.6N/A
Liberal Democrats Richard Burt54618.0-12.1
Labour Barry Mear37012.2-17.8
Majority62920.7+10.8
Turnout 3,03935.3-25.8
Conservative hold Swing
Southwick
PartyCandidateVotes%±%
Conservative Janet Mockridge1,08942.6+2.5
UKIP Jennifer Greig59323.2+16.7
Liberal Democrats John Hilditch35914.0-5.5
Labour Barry Thompson27310.7-18.3
Green Susan Board2459.6+4.6
Majority49619.4+8.3
Turnout 2,55933.1-30.9
Conservative hold Swing

Arun

Angmering & Findon
PartyCandidateVotes%±%
Conservative Deborah Urquhart2,08366.6+16.4
Liberal Democrats Trevor Richards1,04333.4-4.4
Majority1,04033.2+20.8
Turnout 3,12639.7-27.1
Conservative hold Swing
Arundel & Wick
PartyCandidateVotes%±%
Conservative Nigel Peters1,64856.2+18.7
Liberal Democrats Nicholas Wiltshire1,00934.4+7.1
Labour Alan Butcher2749.3-17.0
Majority63921.8+11.6
Turnout 2,93138.2-26.7
Conservative hold Swing
Bersted
PartyCandidateVotes%±%
Liberal Democrats Simon McDougall99233.2+2.8
Conservative Ann Smee87329.2+0.3
UKIP Ann Rapnik51117.1+6.3
Labour Simon Holland32610.9-19.1
BNP Michael Witchell2859.5N/A
Majority1194.0+3.6
Turnout 2,98734.1-24.8
Liberal Democrats hold Swing
Bognor Regis East
PartyCandidateVotes%±%
Liberal Democrats Francis Oppler1,27945.9+13.9
Conservative Philip Hitchins71125.5+3.5
UKIP Philip Lee51718.6+9.0
BNP Albert Bodle27810.0N/A
Majority56820.4+17.9
Turnout 2,78529.9-25.3
Liberal Democrats hold Swing
Bognor Regis West & Aldwick
PartyCandidateVotes%±%
Liberal Democrats Paul Wells1,60644.3+4.8
Conservative Robin Brown1,54542.8-3.3
BNP David Little2647.3N/A
Labour Jan Cosgrave2145.9N/A
Majority611.5
Turnout 3,62940.1-21.8
Liberal Democrats gain from Conservative Swing
East Preston & Ferring
PartyCandidateVotes%±%
Conservative Peter Evans2,95666.0+8.8
Liberal Democrats Christine Brown64914.5-7.7
English Democrat Clive Maltby48210.8N/A
Labour Henry Miller3908.7-6.7
Majority2,30751.5+16.5
Turnout 4,47745.9-23.9
Conservative hold Swing
Felpham
PartyCandidateVotes%±%
Conservative George Blampied1,67654.5+9.3
UKIP Alicia Denny73423.9+14.7
Liberal Democrats Jason Passingham47415.4-16.3
Labour Michelle White1916.2-7.7
Majority94230.6+17.1
Turnout 3,07539.3-29.2
Conservative hold Swing
Fontwell
PartyCandidateVotes%±%
Conservative Derek Whttington2,31064.3+14.4
Liberal Democrats George Fletcher1,28135.7-1.3
Majority1,02928.6+15.7
Turnout 3,59139.9-25.6
Conservative hold Swing
Littlehampton East
PartyCandidateVotes%±%
Liberal Democrats James Walsh1,52545.1+8.0
Conservative Joyce Bowyer1,00729.8-2.2
UKIP Robert East55316.3+7.2
Labour Stephen McConnell1795.3-16.4
BNP James Baxter1203.5N/A
Majority51813.5+8.4
Turnout 3,38438.0-24.3
Liberal Democrats hold Swing
Littlehampton Town
PartyCandidateVotes%±%
Conservative David Britton75728.7+1.8
Liberal Democrats Ian Buckland68926.1+2.1
Labour George O'Neill56821.5-15.6
UKIP Derek Pescud47618.0+6.0
BNP Valerie Manchee1495.6N/A
Majority682.6
Turnout 2,63932.3-21.2
Conservative gain from Labour Swing
Middleton
PartyCandidateVotes%±%
Conservative Christina Freeman1,64049.9-0.9
UKIP Joan Phillips90627.5+18.6
Liberal Democrats David Bliss53116.1-6.8
Labour Edward Nattrass2126.4-12.8
Majority73422.4-3.7
Turnout 3,28939.2-24.4
Conservative hold Swing
Nyetimber
PartyCandidateVotes%±%
Conservative Michael Coleman1,79147.70.0
UKIP Douglas Denny92424.6+15.1
Liberal Democrats Gregory Burt54414.5-6.7
Labour Pauline Nash2476.6-14.9
BNP Paul Cole2456.5N/A
Majority86723.1-3.1
Turnout 3,75141.2-26.9
Conservative hold Swing
Rustington
PartyCandidateVotes%±%
Conservative Graham Tyler2,96269.6+23.5
Liberal Democrats John Lovell98623.2-9.0
Labour Anthony Dines3107.3-7.5
Majority1,97646.4+32.6
Turnout 4,25845.1-22.9
Conservative hold Swing

Chichester

Bourne
PartyCandidateVotes%±%
Conservative Thomas Dunn1,94856.3+15.7
Liberal Democrats Philip MacDougall1,38240.0+7.2
Labour Janet Miller1273.7-10.6
Majority56616.3+8.6
Turnout 3,45737.1-28.5
Conservative hold Swing
Chichester East
PartyCandidateVotes%±%
Liberal Democrats Andrew Smith1,71752.3+11.5
Conservative Norman Dingemans1,16835.6+2.7
BNP Ray Fallick2036.2N/A
Labour June Leonard1966.0-13.5
Majority54916.7+8.8
Turnout 3,28434.5-24.7
Liberal Democrats hold Swing
Chichester North
PartyCandidateVotes%±%
Conservative Michael Hall1,90152.4+17.5
Liberal Democrats Richard Plowman1,11830.8-17.9
UKIP Michael Mason43912.1+6.7
Labour Margaret Dyer1684.6-6.4
Majority78321.6
Turnout 3,62644.0-24.4
Conservative gain from Liberal Democrats Swing
Chichester South
PartyCandidateVotes%±%
Conservative Elizabeth Whitehead1,41942.9+6.2
Liberal Democrats Alan Chaplin1,06832.3-8.2
UKIP Nigel Sitwell 58117.6+10.9
Labour Wendy Pengelly2417.3-8.8
Majority35110.6
Turnout 3,30936.7-28.6
Conservative gain from Liberal Democrats Swing
Chichester West
PartyCandidateVotes%±%
Conservative Mary-Louise Goldsmith2,19055.0+15.6
Liberal Democrats Alix Henry69217.4-15.6
UKIP James McCulloch3809.5+3.6
Green Richard Lanchester3789.5N/A
Labour John Bennett1995.0-9.1
BNP Andrew Emerson1423.6N/A
Majority1,49837.6+31.2
Turnout 3,98143.0-22.3
Conservative hold Swing
Fernhurst
PartyCandidateVotes%±%
Conservative Michael Brown1,99554.9+2.6
Liberal Democrats Matthew Bonfante-Horrox82522.7-9.3
UKIP Andrew Moncrieff64417.7+12.6
Labour John Smith1694.7-6.0
Majority1,17032.2+11.9
Turnout 3,63342.9-27.6
Conservative hold Swing
Midhurst
PartyCandidateVotes%±%
Conservative Nola Hendon2,47968.4+29.9
Liberal Democrats Judith Fowler95226.3-1.7
Labour Andrew Young1955.4N/A
Majority1,52742.1+32.3
Turnout 3,62641.3-26.8
Conservative hold Swing
Petworth
PartyCandidateVotes%±%
Conservative Christopher Duncton2,76970.3+16.1
Liberal Democrats Raymond Cooper81020.6-9.7
BNP Robert Trower2095.3N/A
Labour Brenda Wise1483.8-6.2
Majority1,95949.7+25.8
Turnout 3,93941.1-28.6
Conservative hold Swing
Selsey
PartyCandidateVotes%±%
Conservative Peter Jones1,52547.1+6.9
UKIP Bernard Smith1,29540.0+28.7
Labour Ian Bell41512.8-9.8
Majority2307.1-7.2
Turnout 3,23536.6-28.0
Conservative hold Swing
The Witterings
PartyCandidateVotes%±%
Conservative Justus Montyn1,62749.6+4.3
Independent John Daws-Chew61818.8+18.8
Liberal Democrats Roger Tilbury34610.6-8.6
Green Adrian Mills2928.9N/A
BNP Sylvia Trower2206.7N/A
Labour Patrick O'Sullivan1765.4-6.8
Majority1,00930.8+4.7
Turnout 3,27940.1-26.2
Conservative hold Swing

Crawley

Bewbush & Ifield West
PartyCandidateVotes%±%
Labour Christopher Oxlade86536.0
Conservative Adam Brown75831.5
Liberal Democrats Edward Arnold34414.3
BNP George Baldwin31513.1
Justice Arshad Khan1215.0
Majority1074.5
Turnout 2,40328.5
Labour win (new seat)
Broadfield
PartyCandidateVotes%±%
Conservative Alan Quirk1,36758.2+26.6
Labour Gillian Joyce98341.8-3.7
Majority38416.4
Turnout 2,35027.0-22.2
Conservative gain from Labour Swing
Gossops Green & Ifield East
PartyCandidateVotes%±%
Conservative Keith Blake1,19138.6
Labour John Mortimer89328.9
BNP Dennis Kenealy38712.5
Liberal Democrats Barry Hamilton32410.5
Independent Richard Symonds2919.4
Majority2989.7
Turnout 3,08638.1
Conservative win (new seat)
Langley Green & West Green
PartyCandidateVotes%±%
Labour Brenda Smith1,39645.5
Conservative Lee Gilroy1,14037.2
Liberal Democrats Kevin Osborne53217.3
Majority2568.3
Turnout 3,06833.4
Labour win (new seat)
Maidenbower
PartyCandidateVotes%±%
Conservative Henry Smith2,19272.3
Labour Kieran Byrne42514.0
Liberal Democrats Suhasini Gaurishanker41513.7
Majority1,76758.3
Turnout 3,03234.8
Conservative win (new seat)
Northgate & Three Bridges
PartyCandidateVotes%±%
Conservative Robert Burgess1,17240.2+7.1
Labour William Thomas89130.6-6.2
Liberal Democrats Malcolm Wickins50417.3-5.2
English Democrat Mark Taylor34811.9N/A
Majority2819.6
Turnout 2,91536.8-23.3
Conservative gain from Labour Swing
Pound Hill & Worth
PartyCandidateVotes%±%
Conservative Richard Burrett2,30869.7
Liberal Democrats Eddie Reay64019.3
Labour David Shreeves36110.9
Majority1,66850.4
Turnout 3,30939.1
Conservative win (new seat)
Southgate & Crawley Central
PartyCandidateVotes%±%
Conservative Howard Bloom1,09748.2
Labour Michael Jones89739.4
BNP Linda Atkinson28412.5
Majority2008.8
Turnout 2,27834.7
Labour win (new seat)
Tilgate & Furnace Green
PartyCandidateVotes%±%
Conservative Duncan Crow1,60046.0+5.4
Labour Ian Irvine87125.0-12.5
Liberal Democrats Darren Wise60717.4+0.4
BNP Vernon Atkinson40111.5N/A
Majority72921.0+17.9
Turnout 3,47939.7-23.8
Conservative hold Swing

Horsham

Billingshurst
PartyCandidateVotes%±%
Conservative Amanda Jupp1,70154.1+3.5
UKIP David Duke69422.1N/A
Liberal Democrats Larissa Rowe58818.7-17.0
Labour Christine Conibear1605.1-8.6
Majority1,00732.0+17.1
Turnout 3,14338.4-28.1
Conservative hold Swing
Bramber Castle
PartyCandidateVotes%±%
Liberal Democrats Derek Deedman2,25248.80.0
Conservative David Barling1,66936.2-3.3
UKIP Stuart Bower3517.6N/A
BNP Donna Bailey2264.9N/A
Labour Arleene Piercy1172.5-9.3
Majority58312.6+3.3
Turnout 4,61550.8-19.6
Liberal Democrats hold Swing
Henfield
PartyCandidateVotes%±%
Conservative Lionel Barnard2,22163.5+1.7
Liberal Democrats Andrew Purches83023.7-14.5
BNP Tony Aldous2577.3N/A
Labour Malcolm Uhlhorn1915.5N/A
Majority1,39139.8+16.2
Turnout 3,49942.3-25.4
Conservative hold Swing
Holbrook
PartyCandidateVotes%±%
Conservative Peter Catchpole1,72947.1+2.7
Liberal Democrats Belinda Walters1,59043.3+1.9
BNP Francis Carlin1925.2N/A
Labour Raymond Chapman1614.4-9.8
Majority1393.8+0.8
Turnout 3,67243.0-25.7
Conservative hold Swing
Horsham Hurst
PartyCandidateVotes%±%
Liberal Democrats Nigel Dennis1,69750.8
Conservative Marc Kent87926.3
UKIP Claire Bridewell2798.3
Green Stacey Frier1875.6
Labour Carol Hayton1835.5
BNP Joyce Audric1183.5
Majority81824.5
Turnout 3,34342.3
Liberal Democrats win (new seat)
Horsham Riverside
PartyCandidateVotes%±%
Liberal Democrats Morwen Millson1,98555.7+3.7
Conservative Andrew Baldwin1,28336.0+3.0
Peace Jim Duggan1594.5N/A
Labour Jonathan Austin1373.8-11.2
Majority70219.7+0.7
Turnout 3,56444.6-22.7
Liberal Democrats hold Swing
Horsham Tanbridge & Broadbridge Heath
PartyCandidateVotes%±%
Liberal Democrats David Sheldon1,49656.1
Conservative Laurence Deakins1,03038.6
Labour David Hide1415.3
Majority46617.5
Turnout 2,66739.2
Liberal Democrats win (new seat)
Pulborough
PartyCandidateVotes%±%
Conservative Patricia Arculus2,87173.2+9.5
Liberal Democrats Rosalyn Deedman82921.1-15.2
Labour Antony Bignell2225.7N/A
Majority2,04252.1+24.7
Turnout 3,92242.5-25.7
Conservative hold Swing
Roffey
PartyCandidateVotes%±%
Liberal Democrats Warwick Hellawell1,46848.4+2.9
Conservative John Charles1,16438.4-0.4
BNP Colin Poulter2799.2N/A
Labour Andrew Skudder1234.1-11.6
Majority30410.0+3.3
Turnout 3,03439.8-24.5
Liberal Democrats hold Swing
Southwater & Nuthurst
PartyCandidateVotes%±%
Conservative Brian Watson1,93449.6+1.2
Liberal Democrats Peter Stainton1,07527.5-13.8
UKIP Harry Aldridge51913.3N/A
Green Tristan Loraine2616.7N/A
Labour Jane Field1132.9-7.3
Majority85922.1+15.0
Turnout 3,90240.5-28.5
Conservative hold Swing
Storrington
PartyCandidateVotes%±%
Conservative Frank Wilkinson2,67764.0+5.2
Liberal Democrats Susan Stokes77118.4-6.9
English Democrat Henry Powell52312.5N/A
Labour Margaret Cornwell2155.1-10.8
Majority1,90645.6+12.1
Turnout 4,18643.1-27.0
Conservative hold Swing
Warnham & Rusper
PartyCandidateVotes%±%
Conservative Michael Hodgson1,78358.9+2.4
UKIP Stuart Aldridge58319.3N/A
Liberal Democrats Alan Belmore53517.7-11.2
Labour Sheila Chapman1254.1-10.5
Majority1,20039.6+12.0
Turnout 3,02641.7-25.6
Conservative hold Swing

Mid Sussex

Burgess Hill East
PartyCandidateVotes%±%
Liberal Democrats Susan Knight1,94450.0
Conservative Jacqui Landriani1,76945.5'
Labour Peter Allott1744.5
Majority1754.5
Turnout 3,88741.5
Liberal Democrats win (new seat)
Burgess Hill Town
PartyCandidateVotes%±%
Liberal Democrats Heather Ross1,42141.5
Conservative Andrew Barrett-Miles1,37140.1
UKIP Chris French47613.9
Labour Nigel Foulkes1524.4
Majority501.4
Turnout 3,42038.1
Liberal Democrats win (new seat)
Cuckfield & Lucastes
PartyCandidateVotes%±%
Conservative Peter Bradbury1,70346.8-6.2
Liberal Democrats Stephen Blanch77021.2-10.1
Independent Michael Bright64417.7N/A
UKIP Marc Montgomery2186.0N/A
Green Catherine Edminson2085.7-1.4
Labour Derek Davies952.6-5.9
Majority93325.6+3.9
Turnout 3,63845.4-27.4
Conservative hold Swing
East Grinstead Meridian
PartyCandidateVotes%±%
Conservative Liz Bennett1,40847.5
Liberal Democrats Paul Johnson1,15338.9
Green James Blair30010.1
Labour Colin Moffatt1033.5
Majority2558.6
Turnout 2,96435.6
Conservative win (new seat)
East Grinstead South & Ashurst Wood
PartyCandidateVotes%±%
Conservative Lee Quinn1,59944.5
Liberal Democrats Margaret Collins1,46940.9
Green Paul Brown42911.9
Labour Peter Lamb942.6
Majority1303.6
Turnout 3,59141.2
Conservative win (new seat)
Hassocks & Victoria
PartyCandidateVotes%±%
Liberal Democrats Colin Wilsdon2,15950.4+7.5
Conservative Mandy Thomas-Atkin1,89544.2+4.1
Labour Jennifer Epstein2044.8-5.8
Majority2646.2+3.4
Turnout 4,25843.9-26.0
Liberal Democrats hold Swing
Haywards Heath East
PartyCandidateVotes%±%
Liberal Democrats Anne Hall1,23741.2+8.2
Conservative John de Mierre1,19439.7+3.4
Labour Osiji Onah40613.5-17.2
BNP Richard Trower1685.6N/A
Majority431.5
Turnout 3,00539.1-28.5
Liberal Democrats gain from Conservative Swing
Haywards Heath Town
PartyCandidateVotes%±%
Liberal Democrats Brian Hall1,47744.0+4.6
Conservative Katy Bourne1,41642.2+3.6
Green Philip Smith2898.6+2.5
Labour Pascal Atkins1755.2-10.7
Majority611.8+1.0
Turnout 3,35740.1-29.9
Liberal Democrats hold Swing
Hurstpierpoint & Bolney
PartyCandidateVotes%±%
Conservative Peter Griffiths2,03858.4+4.6
Liberal Democrats Rodney Jackson72720.8-7.5
Green Michael Airey52915.1N/A
Labour Ann Morgan1985.7-8.5
Majority1,31137.6+12.1
Turnout 3,49244.6-26.1
Conservative hold Swing
Imberdown
PartyCandidateVotes%±%
Liberal Democrats Heidi Brunsdon1,52244.1+19.0
Conservative Phillip Coote1,37039.7-8.8
UKIP Eric Saunders41211.9N/A
Labour Alison Cornell1444.2-6.9
Majority1524.4
Turnout 3,44842.6-29.3
Liberal Democrats gain from Conservative Swing
Lindfield & High Weald
PartyCandidateVotes%±%
Conservative Christine Field2,57357.9+5.9
Liberal Democrats Anne-Marie Lucraft98322.1-7.6
Green Peter Wemyss-Gorman72816.4+7.0
Labour Alan Yates1583.6-5.3
Majority1,59035.8+13.5
Turnout 4,44247.0-26.5
Conservative hold Swing
Worth Forest
PartyCandidateVotes%±%
Conservative William Acraman2,14761.2+7.8
Liberal Democrats Nicholas Dennis61717.6-4.5
Green Maurice Weller51814.8+7.3
Labour Frank Thomson2256.4-10.6
Majority1,53043.6+12.3
Turnout 3,50737.5-31.0
Conservative hold Swing

Worthing

Broadwater
PartyCandidateVotes%±%
Liberal Democrats Alan Rice1,24538.8
Conservative Tom Wye1,23038.3
UKIP Lionel Parsons55917.4
Labour John Turley1775.5
Majority150.5
Turnout 3,21133.0
Liberal Democrats win (new seat)
Cissbury
PartyCandidateVotes%±%
Conservative Clement Stevens1,92552.8
UKIP Mike Glennon88824.4
Liberal Democrats Wayne Hoban64117.6
Labour John Gardiner1915.2
Majority1,03728.4
Turnout 3,64542.6
Conservative win (new seat)
Durrington & Salvington
PartyCandidateVotes%±%
Conservative Nicola Waight1,30839.5
Liberal Democrats Michael Donin1,23537.3
UKIP John Wallace76823.2
Majority732.2
Turnout 3,31134.4
Conservative win (new seat)
Goring
PartyCandidateVotes%±%
Conservative Steve Waight1,72754.0
UKIP Richard Bater64620.2
Liberal Democrats Nick John57618.0
Labour James Elwood2487.8
Majority1,08133.8
Turnout 3,19739.4
Conservative win (new seat)
Northbrook
PartyCandidateVotes%±%
Liberal Democrats Robin Rogers1,52457.9
Conservative John Rogers97437.0
Labour Bren Albiston1355.1
Majority55020.9
Turnout 2,63331.6
Liberal Democrats win (new seat)
Tarring
PartyCandidateVotes%±%
Liberal Democrats Robert Smytherman1,64647.4
Conservative Paul High1,00729.0
UKIP John Harwood62818.1
Labour Sid Wells1915.5
Majority63918.4
Turnout 3,47235.3
Liberal Democrats win (new seat)
Worthing East
PartyCandidateVotes%±%
Liberal Democrats Irene Richards1,15740.9-1.0
Conservative Roger Oakley1,01235.8-3.8
UKIP Mick Clark42415.0N/A
Labour Ann Saunders2338.2-10.4
Majority1455.1+2.8
Turnout 2,82635.2-22.3
Liberal Democrats hold Swing
Worthing Pier
PartyCandidateVotes%±%
Liberal Democrats James Doyle1,09740.1+5.6
Conservative Paul Yallop1,01537.1-3.3
UKIP Christopher Woodward35012.8N/A
Labour Sue Marsh1816.6-10.1
English Democrat Michael Black-Feather933.4N/A
Majority823.0
Turnout 2,73632.0-20.5
Liberal Democrats gain from Conservative Swing
Worthing West
PartyCandidateVotes%±%
Conservative John Livermore1,52948.9+3.7
Liberal Democrats Yvonne Leonard73123.4-1.4
UKIP Phil Ruddock61619.7+14.6
Labour Eileen Powell2487.9-7.8
Majority79825.5+5.1
Turnout 3,12436.3-24.2
Conservative hold Swing

Related Research Articles

<span class="mw-page-title-main">Aberdeen South (UK Parliament constituency)</span> Parliamentary constituency in the United Kingdom, 1885 onwards

Aberdeen South is a burgh constituency of the House of Commons of the Parliament of the United Kingdom and it elects one Member of Parliament (MP) by the first-past-the-post system of election.

<span class="mw-page-title-main">Eastbourne (UK Parliament constituency)</span> UK Parliament constituency since 1885

Eastbourne is a constituency for the House of Commons of the UK Parliament. It was created as one of nine in Sussex in 1885, since when it has reduced in geographic size reflecting the growth of its main settlement, Eastbourne.

<span class="mw-page-title-main">Leeds North East (UK Parliament constituency)</span> Parliamentary constituency in the United Kingdom

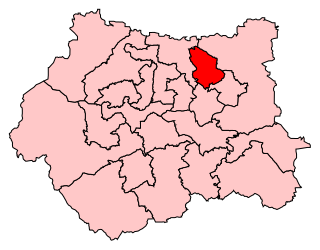
Leeds North East is a constituency which has been represented in the House of Commons of the UK Parliament since 1997 by Fabian Hamilton of the Labour Party.

<span class="mw-page-title-main">2005 United Kingdom local elections</span>

The 2005 United Kingdom local elections were held on Thursday 5 May 2005, with various councils and local government seats being contested in England and Northern Ireland, and a local referendum taking place on the Isle of Wight on the issue of a directly elected mayor. These local elections were held in conjunction with the 2005 general election across the entire United Kingdom.

<span class="mw-page-title-main">Edinburgh Central (Scottish Parliament constituency)</span> Burgh constituency of the Scottish Parliament

Edinburgh Central is a burgh constituency of the Scottish Parliament (Holyrood) covering part of the council area of Edinburgh. It elects one Member of the Scottish Parliament (MSP) by the plurality method of election. It is also one of nine constituencies in the Lothian electoral region, which elects seven additional members, in addition to the nine constituency MSPs, to produce a form of proportional representation for the region as a whole.

<span class="mw-page-title-main">1966 South African general election</span>

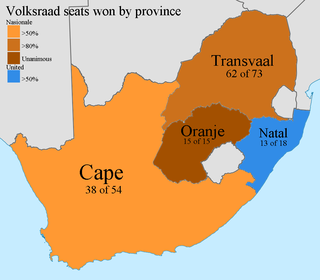
General elections were held in South Africa on 30 March 1966. The result was another comprehensive victory for the National Party under H. F. Verwoerd.

<span class="mw-page-title-main">1997 United Kingdom local elections</span>

The 1997 United Kingdom local elections took place on Thursday 1 May 1997 in England, and Wednesday 21 May 1997 in Northern Ireland. Elections took place for all of the English country councils, some English unitary authorities and all of the Northern Ireland districts. The local elections were held on the same day as the 1997 general election.

<span class="mw-page-title-main">Maidenbower (electoral division)</span>

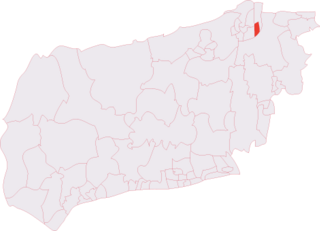
Maidenbower is an electoral division of West Sussex in the United Kingdom, and returns one member to sit on West Sussex County Council. The current County Councillor, is Robert Lanzer who won the seat in a by-election after the resignation of the former Leader of West Sussex County Council Henry Smith upon being elected as Member of Parliament for Crawley.

This is the results breakdown of the 2005 general election.

<span class="mw-page-title-main">1993 United Kingdom local elections</span>

The 1993 United Kingdom local elections were held on Thursday 6 May 1993 in England and Wales, and Wednesday 19 May 1993 in Northern Ireland. The results showed a decline for the governing Conservative Party, who were still reeling from the fallout of Black Wednesday; with the third-placed party, the Liberal Democrats, gaining most seats.

<span class="mw-page-title-main">2005 United Kingdom general election in Scotland</span>

A general election was held in the United Kingdom on 5 May 2005 and all 59 seats in Scotland were contested. This was the first election to occur under the new boundaries which reduced the number of Scottish seats from 72 to 59. Previously, Scotland had a greater number of MPs per person than the rest of the UK to compensate for its distinct political nature and distance from Westminster. With the introduction of the Scottish Parliament, Scottish constituencies were brought into line with those found in the rest of the UK, so that they had similar electorates.

<span class="mw-page-title-main">1982 Strathclyde Regional Council election</span> Strathclyde Regional Council election

Elections to Strathclyde Regional Council were held on Thursday 6 May 1982, on the same day as the eight other Scottish regional elections. This was the third election to the regional council following the local government reforms in the 1970s.

<span class="mw-page-title-main">2013 West Sussex County Council election</span> 2013 UK local government election

The West Sussex County Council election, 2013 took place on 2 May 2013, as part of the 2013 United Kingdom local elections. All 71 electoral divisions were up for election, which returned one county councillor each by first-past-the-post voting for a four-year term of office. At this election, the Conservative Party was seeking to retain overall control of the council, and the Liberal Democrats to maintain their position as the main opposition party.

<span class="mw-page-title-main">2013 Staffordshire County Council election</span> UK local elections

An election to Staffordshire County Council took place on 2 May 2013 as part of the 2013 United Kingdom local elections. 62 electoral divisions returned one county councillor each by first-past-the-post voting for a four-year term of office. Following a boundary review, new electoral division boundaries were established for this election. No elections were held in Stoke-on-Trent, which is a unitary authority outside the area covered by the County Council. The council continues to be administered on the Leader and Cabinet model.

<span class="mw-page-title-main">2017 United Kingdom local elections</span>

The 2017 United Kingdom local elections were held on Thursday 4 May 2017. Local elections were held across Great Britain, with elections to 35 English local authorities and all councils in Scotland and Wales.

<span class="mw-page-title-main">2017 Kent County Council election</span> 2017 UK local government election

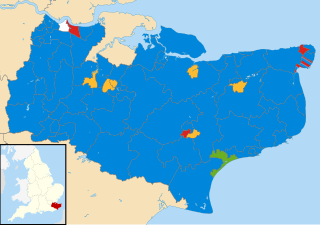
The 2017 Kent County Council election was held on 4 May 2017 as part of the 2017 local elections in the United Kingdom. All 81 councillors were elected from 72 electoral divisions, each of which returned either one or two county councillors by first-past-the-post voting for a four-year term of office. The Conservative Party retained control. UKIP, previously the second-largest party on the council, lost all their seats.

<span class="mw-page-title-main">2017 West Sussex County Council election</span> 2017 UK local government election

The 2017 West Sussex County Council election took place as part of the 2017 local elections in the UK. All councillors were elected for single-member electoral divisions for a four-year term. The voting system used was first-past-the-post.

<span class="mw-page-title-main">Wards of Glasgow</span> Electoral Districts in Glasgow, Scotland

The City of Glasgow is divided into a number of wards. These electoral districts, as they are also known, are used to elect councillors to Glasgow City Council. The council, composed of the elected members from each ward, provides local government services to the City of Glasgow.

Elections to South Lanarkshire Council were held on 6 May 1999, alongside elections to the Scottish Parliament. This was the second election following the local government reforms in 1994 and the first following the Third Statutory Reviews of Electoral Arrangements which resulted in six fewer seats from the previous election.

<span class="mw-page-title-main">2022 Scottish local elections</span>

The 2022 Scottish local elections were held on 5 May 2022, as part of the 2022 United Kingdom local elections. All 1,226 seats across all 32 Scottish local authorities were up for election and voter turnout was 44.8%.

References