2009 Nottinghamshire County Council election

Last updated

2009 Nottinghamshire County Council election
County Flag of Nottinghamshire.svg
  2005 4 June 2009 2013  

All 67 seats to Nottinghamshire County Council
34 seats needed for a majority
 First partySecond partyThird party
 
Party Conservative Labour Liberal Democrats
Last election26365
Seats before26364
Seats won36149
Seat changeIncrease2.svg10Decrease2.svg22Increase2.svg5
Percentage52.2419.4013.43

 Fourth partyFifth party
 
Party Independent UKIP
Last election00
Seats before10
Seats won71
Seat changeIncrease2.svg6Increase2.svg1
Percentage13.431.49

Nottinghamshire election 2009.svg
Map of the results of the election coloured by victorious party

Leader before election


Labour

Elected Leader


Conservative

Elections to Nottinghamshire County Council took place on 4 June 2009, having been delayed from 7 May, in order to coincide with elections to the European Parliament.

Contents

In the previous election, held on 5 May 2005, the Labour Party won a majority with 36 out of 67 seats. The Conservative Party were second with 26 seats, and the Liberal Democrats had five. [1] Following the 2005 election, there were three by-elections, which all saw swings against Labour. The Conservatives gained Hucknall and the Liberal Democrats Sutton-in-Ashfield North from Labour, and the Labour Party's majority in Mansfield East was reduced by nearly two-thirds. [2]

Campaign

A key local issue was the planned extension of the Nottingham Express Transit tram system to Clifton and Toton, which was opposed by the Conservatives. [3]

Results by District

Nottinghamshire County Council is made up of 67 seats in a total of 54 electoral divisions across 7 districts: Ashfield District, Bassetlaw District, Broxtowe Borough, Gedling Borough, Mansfield District, Newark & Sherwood District, and Rushcliffe Borough. [4]

Ashfield District

(10 seats, 8 electoral divisions)

Hucknall

Hucknall (3 seats)
PartyCandidateVotes%
Conservative Mick Murphy2,69011.06
UKIP Tom Irvine2,54110.45
Conservative Kevin Thomas Rostance2,51910.36
Conservative Robert Rankin2,49810.27
Labour Chris Baron2,3939.84
Labour Dave Shaw2,2589.29
Labour Trev Locke2,2139.10
UKIP Kenneth Browne1,2044.95
UKIP Mark Brinsley-Day1,2024.94
Liberal Democrats Kevin Moore1,1254.63
Liberal Democrats Harry Toseland1,0584.35
BNP Susan Carolyn Gamble9053.72
Liberal Democrats Austin Rathe8813.62
English Democrat Kevin Michael Worrall6022.48
Independent Geoff Thorpe2230.92
Turnout 8,10434.07

Kirkby in Ashfield North

Kirkby in Ashfield North (1 seat)
PartyCandidateVotes%
Labour John Russell Knight84226.38
BNP Michael John Clarke72222.62
Independent Wendy Brenda Harvey59718.70
Conservative James Grant Thornton44513.94
Liberal Democrats Melvin William Grant41212.91
Independent Dave Spalding1745.45
Turnout 3,19231.27

Kirkby in Ashfield South

Kirkby in Ashfield South (1 seat)
PartyCandidateVotes%
Liberal Democrats Rachel Elisabeth Madden1,75239.29
Labour Yvonne Davidson86819.47
Conservative Robert Copley61413.77
BNP Darran Paul Burke48210.81
English Democrat Tony Ellis2956.62
Green Lisa Jane Brown2575.76
Independent Tony Brown1914.28
Turnout 4,45940.39

Selston

Selston (1 seat)
PartyCandidateVotes%
Independent Gail Turner1,59336.68
Liberal Democrats Robert James Sears-Piccavey1,03723.88
BNP Edward Holmes73416.90
Labour Stephen John Mays55712.83
Conservative Brian William Jarvis3437.90
Green Kevin Bradford791.82
Turnout 4,34343.40

Sutton in Ashfield Central

Sutton in Ashfield Central (1 seat)
PartyCandidateVotes%
Liberal Democrats Michelle Gent80129.64
Labour Edward David Walter Llewellyn-Jones69625.76
Conservative Christine Margaret Vernon38414.21
BNP Jane Helen Clarke34712.84
Independent Leslie Matthews27610.21
Independent Tony Johnson1987.33
Turnout 2,70231.26

Sutton in Ashfield East

Sutton in Ashfield East (1 seat)
PartyCandidateVotes%
Labour Steven Terence Carroll77227.32
Liberal Democrats Philip Ashley Smith62822.22
Conservative John Matson Baker42615.07
Independent Tony Wallis40114.19
Independent David Michael Parker30010.62
BNP Paul Jeffrey Gamble29910.58
Turnout 2,82632.05

Sutton in Ashfield North

Sutton in Ashfield North (1 seat)
PartyCandidateVotes%
Liberal Democrats Jason Bernard Zadrozny1,03835.40
Labour Trish Phillips73825.17
Conservative Michael Peter Laing Halls56219.17
BNP Michael John Clarke41814.26
Turnout 2,93234.32

Sutton in Ashfield West

Sutton in Ashfield West (1 seat)
PartyCandidateVotes%
Liberal Democrats Fiona Asbury1,06636.48
Labour David John Kirkham75825.94
Conservative Michael Maurice Champion52217.86
BNP Hilda Holmes38213.07
Turnout 2,92232.98

Bassetlaw District

(9 seats, 9 electoral divisions)

Blyth & Harworth

Blyth & Harworth (1 seat)
PartyCandidateVotes%
Labour Sheila Janice Place1,66352.71
Conservative Chris Wanless1,49247.29
Turnout 3,22634.13

Misterton

Misterton (1 seat)
PartyCandidateVotes%
Conservative Liz Yates3,32176.45
Labour David Challinor1,02323.55
Turnout 4,47742.52

Retford East

Retford East (1 seat)
PartyCandidateVotes%
Conservative Wendy Quigley1,93362.05
Labour Mick Storey1,18237.95
Turnout 3,18237.30

Retford West

Retford West (1 seat)
PartyCandidateVotes%
Conservative Mike Quigley1,30546.26
Labour James Trebor Arthur Napier94233.39
Liberal Democrats David Anthony Hassett57420.35
Turnout 2,85334.25

Tuxford

Tuxford (1 seat)
PartyCandidateVotes%
Conservative John Marshall Hempsall2,51161.02
Liberal Democrats Brian Sydney Cane91022.11
Labour Marilyn McCarthy69416.87
Turnout 4,17944.95

Worksop East

Worksop East (1 seat)
PartyCandidateVotes%
Labour Glynn Gilfoyle1,52554.19
Independent Geoff Coe76227.08
Conservative Tracey Lee Taylor52718.73
Turnout 2,87130.64

Worksop North

Worksop North (1 seat)
PartyCandidateVotes%
Labour Sybil Jacqueline Fielding1,71154.54
Conservative Jonathan Neil Sheppard1,42645.46
Turnout 3,22831.38

Worksop North East & Carlton

Worksop North East & Carlton (1 seat)
PartyCandidateVotes%
Labour Alan Rhodes1,66951.07
Conservative Bill Graham1,59948.93
Turnout 3,36236.26

Worksop West

Worksop West (1 seat)
PartyCandidateVotes%
Conservative Michael Bennett1,40350.81
Labour David Daniel Potts90932.92
Liberal Democrats Mark Peter Hunter44916.26
Turnout 2,78933.27

Broxtowe Borough

(10 seats, 8 electoral divisions)

Beauvale

Beauvale (1 seat)
PartyCandidateVotes%
Conservative David Taylor1,53243.31
BNP Dave Brown69819.73
Liberal Democrats Bob Charlesworth65718.58
Labour Jen Cole65018.38
Turnout 3,55443.56

Beeston North

Beeston North (1 seat)
PartyCandidateVotes%
Liberal Democrats Steve Carr2,02653.12
Conservative Philip Hopkinson90523.73
Labour Kate Foale54914.39
Green Paul David Anderson3348.76
Turnout 3,83348.54

Beeston South & Attenborough

Beeston South & Attenborough (1 seat)
PartyCandidateVotes%
Conservative Eric Kerry1,88941.02
Labour Pat Lally1,70036.92
Liberal Democrats Graham Morley Hopcroft4329.38
Green Sylvia Anne Rule3066.64
BNP Wayne Shelbourn2786.04
Turnout 4,61951.16

Bramcote & Stapleford

Bramcote and Stapleford (2 seats)
PartyCandidateVotes%
Liberal Democrats Stan Heptinstall3,28121.03
Liberal Democrats Brian Wombwell3,09519.84
Conservative John Doddy2,52816.21
Conservative Philip Brooks-Stephenson2,24514.39
Labour John William McGrath1,4189.09
Labour Geoff Ward1,1197.17
UKIP Chris Cobb1,0136.49
Green Emma Kathryn Fawcett5073.25
Green Mary Evelyn Venning3942.53
Turnout 7,81445.49

Chilwell & Toton

Chilwell and Toton (2 seats)
PartyCandidateVotes%
Conservative Tom Pettengell3,38824.40
Conservative Richard Ian Jackson3,35624.17
Labour Ed Jacobs1,44210.39
Labour Atul Joshi1,1358.17
Liberal Democrats Dave Pearson1,0767.75
Liberal Democrats Christine Wombwell9987.19
UKIP Keith Willoughby Marriott7865.66
Green Richard David Eddleston6584.74
BNP Mary Clifton5463.93
Green David Knight Mitchell5003.60
Turnout 6,76942.60

Eastwood

Eastwood (1 seat)
PartyCandidateVotes%
Liberal Democrats Keith Longdon1,53949.66
Labour Milan Radulovic88828.65
Conservative Graham Kilbourne67221.68
Turnout 3,15138.26

Kimberley & Trowell

Kimberley & Trowell (1 seat)
PartyCandidateVotes%
Liberal Democrats Ken Rigby1,58536.29
Conservative Shane Easom1,34230.73
Labour Richard Robinson91220.88
BNP Kevin Lambert4029.21
Green Gordon Brian Stoner1262.89
Turnout 4,37749.01

Nuthall

Nuthall (1 seat)
PartyCandidateVotes%
Conservative Philip John Owen1,75250.16
Independent Sue Wildey1,74149.84
Turnout 3,52645.33

Gedling Borough

(10 seats, 6 electoral divisions)

Arnold North

Arnold North (2 seats)
PartyCandidateVotes%
Conservative Gerald Vincent Clarke3,34325.50
Conservative Veronica Caroline Pepper3,25524.83
Labour Pauline Annette Allan1,99515.22
Labour John Robert Stocks1,80513.77
Liberal Democrats Sandra Yvonne Thornley1,36110.38
Liberal Democrats Roger Mark Patterson1,35210.31
Turnout 6,86937.09

Arnold South

Arnold South (2 seats)
PartyCandidateVotes%
Conservative Rodney Gordon Kempster3,25722.28
Conservative Melvyn Alfred Shepherd2,94820.17
Labour Peter Graham Barnes2,21015.12
Labour Paul Richard Key2,04413.98
Liberal Democrats Andrew Julian Swift1,52110.41
Liberal Democrats Tadeusz Edward Zdzislaw Jones1,50210.28
UKIP Anthony Robin Ellwood1,1357.76
Turnout 7,79341.98

Calverton

Calverton (1 seat)
PartyCandidateVotes%
Conservative Mark Spencer (British politician) 2,22970.47
Labour Michael John Hope93429.53
Turnout 3,23640.70

Carlton East

Carlton East (2 seats)
PartyCandidateVotes%
Labour William John Clarke2,16516.03
Conservative Allen Malpass Clarke2,14415.87
Labour James O'Riordan2,09915.54
Conservative Cheryl Beverly Clarke2,03515.06
Liberal Democrats Richard James Dawson Berry1,96014.51
Liberal Democrats Richard Ian MacDuff Fife1,81113.41
BNP Stephen Arthur Adcock7395.47
Green Jean Katimertzis5564.12
Turnout 7,10641.11

Carlton West

Carlton West (2 seats)
PartyCandidateVotes%
Labour Seamus Martin Creamer2,19116.76
Labour Darrell Eduard Pulk2,15216.47
Conservative Thomas Lewis Butcher2,03015.53
Conservative Eric John Collin2,02515.49
Liberal Democrats Paul Anthony Hughes1,0728.20
Liberal Democrats Christopher Norman Fredrick William Pratt9947.61
UKIP Deva Indera Asanga Kumarasiri9747.45
UKIP Anthony Jeffrey Prior9717.43
BNP William Christopher Bell6605.05
Turnout 6,78438.81

Newstead

Newstead (1 seat)
PartyCandidateVotes%
Conservative Christopher Paul Barnfather2,45473.85
Labour Carol Ann Wright86926.15
Turnout 3,32342.95

Mansfield District

(9 seats, 5 electoral divisions)

Mansfield East

Mansfield East (2 seats)
PartyCandidateVotes%
Mansfield Independent ForumBob Cross1,89119.60
Mansfield Independent ForumMartin Wright1,88319.52
Labour Helen Holt1,62916.89
Conservative Brian Marshall1,55816.15
Labour Chris Winterton1,42314.75
Conservative Muriel Ragis1,26213.08
Turnout 5,67731.34

Mansfield North

Mansfield North (2 seats)
PartyCandidateVotes%
Labour Joyce Bosnjak1,75815.93
Labour Parry Tsimbiridis1,49413.54
UKIP Andrea Hamilton1,33512.10
UKIP David Hamilton1,32812.04
Mansfield Independent ForumMick Barton1,0339.36
Conservative Drew Stafford1,0079.13
Conservative Janet Susan Ward9088.23
Mansfield Independent ForumDavid Smith7646.92
Liberal Democrats Veronica Moya Goddard7566.85
Liberal Democrats Marc Hollingworth6515.90
Turnout 5,78732.19

Mansfield South

Mansfield South (2 seats)
PartyCandidateVotes%
Mansfield Independent ForumTom Appleby2,04317.74
Mansfield Independent ForumStephen Neil Garner1,96017.02
Conservative Nick Bennett1,79115.55
Conservative Philip Keith Smith1,48312.88
Labour Albert Haynes1,25910.93
Labour David Charles Harrison1,18710.31
Liberal Democrats Adrian Mark Bacon6986.06
Liberal Democrats Kristyna Adela Ellis6105.30
English Democrat Diane Bilgrami4874.23
Turnout 6,12132.02

Mansfield West

Mansfield West (2 seats)
PartyCandidateVotes%
Mansfield Independent ForumJune Stendall2,03421.12
Mansfield Independent ForumVic Bobo1,67517.40
Labour Paul Henshaw1,52015.79
Labour John Carter1,51115.69
Conservative Mark Stuart Fretwell8899.23
Conservative Fraser McFarland7167.44
Liberal Democrats Anna Ellis6536.78
Liberal Democrats Nicholas Spencer6316.55
Turnout 5,14130.21

Warsop

Warsop (1 seat)
PartyCandidateVotes%
Labour John Allin1,37148.50
Mansfield Independent ForumJohn Milnes67723.95
Conservative Michael William Ward58320.62
Liberal Democrats Victoria Tracey Zadrozny1966.93
Turnout 2,84630.62

Newark & Sherwood District

(10 seats, 10 electoral divisions)

Balderton

Balderton (1 seat)
PartyCandidateVotes%
Conservative Keith Walker1,40159.11
Liberal Democrats Neil Allen55923.59
Labour Carola Richards41017.30
Turnout 2,39931.37

Blidworth

Blidworth (1 seat)
PartyCandidateVotes%
Independent Geoff Merry85234.68
Labour Yvonne Woodhead80232.64
Conservative Rod Allen49620.19
Independent Kevan Wakefield30712.49
Turnout 2,46832.69

Collingham

Collingham (1 seat)
PartyCandidateVotes%
Conservative Vincent Henry Dobson2,16061.98
Liberal Democrats Marylyn Rayner1,32538.02
Turnout 3,55036.70

Farndom & Muskham

Farndom & Muskham (1 seat)
PartyCandidateVotes%
Conservative Sue Saddington2,17868.86
Liberal Democrats Antony Barson65720.77
Labour Brian James Howes32810.37
Turnout 318347.61

Farnsfield & Lowdham

Farnsfield & Lowdham (1 seat)
PartyCandidateVotes%
Conservative Andy Stewart 3,33379.13
Labour Celia Brooks87920.87
Turnout 4,30250.06

Newark East

Newark East (1 seat)
PartyCandidateVotes%
Conservative Peter David Prebble1,26751.63
Liberal Democrats Chris Harrison74630.40
Labour John Bell44117.97
Turnout 2,48331.52

Newark West

Newark West (1 seat)
PartyCandidateVotes%
Conservative Keith Frank Girling98042.61
Independent Gill Dawn48321.00
Labour Ian Wallace Campbell45019.57
Liberal Democrats Declan Patrick Logue38716.83
Turnout 2,31332.16

Ollerton & Boughton

Ollerton & Boughton (1 seat)
PartyCandidateVotes%
Labour Stella Marie Smedley1,20240.61
Conservative Mary Brown1,04235.20
Independent Mick McLelland71624.19
Turnout 2,98034.24

Rufford

Rufford (1 seat)
PartyCandidateVotes%
Independent Les Ward1,30935.60
Conservative Mike Butler1,25934.24
Labour Andrew Freeman1,10930.16
Turnout 3,71837.07

Southwell & Caunton

Southwell & Caunton (1 seat)
PartyCandidateVotes%
Conservative Bruce Laughton2,76552.06
Liberal Democrats Peter Richard Bloomfield Harris2,28142.95
Labour Glenn Bardill2654.99
Turnout 5,35056.00

Rushcliffe Borough

(9 seats, 8 electoral divisions)

Bingham

Bingham (1 seat)
PartyCandidateVotes%
Conservative Martin William Suthers2,02048.71
Liberal Democrats George Davidson1,20729.11
Independent Terry Coleman51012.30
Labour Alan Richard Tiplady4109.89
Turnout 4,16643.92

Cotgrave

Cotgrave (1 seat)
PartyCandidateVotes%
Conservative Richard Langton Butler1,80753.05
Labour Andrew William Clayworth52215.33
Liberal Democrats Diane Jean Rotherham38711.36
UKIP Rach Wolfe36710.78
BNP Tony Woodward3239.48
Turnout 3,42040.21

Keyworth

Keyworth (1 seat)
PartyCandidateVotes%
Conservative John Elliott Cottee2,48456.11
Liberal Democrats Debbie Boote1,31329.66
Green Tony Latham3718.38
Labour Richard Theodore Parry Crawley2595.85
Turnout 4,45453.17

Radcliffe on Trent

Radcliffe on Trent (1 seat)
PartyCandidateVotes%
Conservative Kay Cutts2,72458.77
Labour Steve Collins78416.91
Liberal Democrats Susan Jennifer Hull61313.23
Green Andrew Peter Mattison51411.09
Turnout 4,66548.33

Ruddington

Ruddington (1 seat)
PartyCandidateVotes%
Conservative Reg Adair1,91848.68
Liberal Democrats Barbara Venes98124.90
Labour Ian Paul Wilson40310.23
UKIP Pete Wolfe39810.10
Independent David John Hall2406.09
Turnout 3,95745.55

Soar Valley

Soar Valley (1 seat)
PartyCandidateVotes%
Conservative Lynn Sykes2,50259.60
Liberal Democrats Sheila Ann Gauld88521.08
Labour Paul David Morrissey81119.32
Turnout 4,26245.82

West Bridgford Central & South

West Bridgford Central and South (2 seats)
PartyCandidateVotes%
Conservative Michael John Cox3,43220.14
Conservative Barrie Cooper3,40119.96
Green Sue Mallender1,78710.49
Green Richard Mallender1,6169.48
Labour Liz Plant1,5789.26
Labour Alistair MacInnes1,5639.17
Liberal Democrats Keith Michael Jamieson1,2237.18
Liberal Democrats Steve Travis1,2177.14
UKIP Matthew Eric Faithfull6233.66
Turnout 8,82043.25

West Bridgford West

West Bridgford West (1 seat)
PartyCandidateVotes%
Conservative Gordon Wheeler2,18944.58
Liberal Democrats Karrar Ahmad Khan1,59732.53
Labour Peter Joseph Vallelly54511.10
Green Simon Ronald Anthony3116.33
English Democrat Barrie Michael Worrall2685.46
Turnout 4,92650.31

By-Elections between June 2009 – April 2013

By-elections are called when a representative Councillor resigns or dies, so are unpredictable. A by-election is held to fill a political office that has become vacant between the scheduled elections.

1. Newark East - 17 September 2009

Newark East By-Election 17 September 2009 [5]
PartyCandidateVotes%±%
Conservative Stuart Wallace51745.2-6.4
Liberal Democrats Chris Harrison32228.1-2.3
Labour Glenn Bardill19817.3-0.7
UKIP Terry Coleman1079.4+9.4
Majority19517.1
Turnout 1,14415.6
Conservative hold Swing

2. Mansfield South - 25 February 2010

Mansfield South By-Election 25 February 2010 [6]
PartyCandidateVotes%±%
Labour Chris Winterton1,34233.5+13.4
Mansfield Independent ForumAndrew Tristram1,10827.6-12.7
Conservative Drew Stafford77419.3-9.2
UKIP Nick Bennet48912.2+12.2
Liberal Democrats Danielle Gent2957.4-3.8
Majority2345.9
Turnout 4,00820.9
Labour gain from Independent Swing

3. Worksop West - 16 September 2010

Worksop West By-Election 25 February 2010 [6]
PartyCandidateVotes%±%
Labour Kevin Maurizio Greaves1,45761.5%
Conservative Alec Thorpe75531.9%
Liberal Democrats Leon Maurice Duveen883.7%
IndependentRonald Dawes562.4%
IndependentTerry George Coleman130.6%
Majority702
Turnout 2,369
Labour gain from Conservative Swing

4. Chilwell & Toton - 15 March 2012

Chilwell & Toton By-Election 15 March 2012
PartyCandidateVotes%±%
Conservative John Doddy1,95847.7+5.9
Liberal Democrats David Watts1,37533.5+20.6
UKIP Lee Waters68216.6+7.0
Majority58314.2
Turnout 4,10225.6
Conservative hold Swing

5. Rufford - 20 September 2012

Rufford By-Election 20 September 2012
PartyCandidateVotes%±%
Labour John Peck1,55758.0+27.8
Conservative Daniel Mottishaw66024.6-9.7
Nottinghamshire IndependentsJim Gregson34612.9-22.7
UKIP Carole Terzza1234.6+4.6
Majority89733.4
Turnout 2,68624.52
Labour gain from Independent Swing

Related Research Articles

<span class="mw-page-title-main">Nottinghamshire</span> County of England

Nottinghamshire is a ceremonial county in the East Midlands of England. The county borders South Yorkshire to the north-west, Lincolnshire to the east, Leicestershire to the south, and Derbyshire to the west. The largest settlement is the city of Nottingham (323,632).

<span class="mw-page-title-main">Bassetlaw District</span> Northernmost district of Nottinghamshire, England

Bassetlaw is a local government district in north Nottinghamshire, England. Its council is based in the town of Worksop; the other towns in the district are Tuxford, Harworth Bircotes and Retford. Bassetlaw is bounded to the south by the Newark and Sherwood and Mansfield districts, to the south-west by the Bolsover district of Derbyshire, to the north-west by the Metropolitan Boroughs of Rotherham and Doncaster in South Yorkshire, to the north by North Lincolnshire, and to the east by West Lindsey. The district is a non-constituent member of the South Yorkshire Mayoral Combined Authority.

<span class="mw-page-title-main">Newark and Sherwood</span> Non-metropolitan local government district in Nottinghamshire, England

Newark and Sherwood is a local government district and is the largest district in Nottinghamshire, England. The district was formed on 1 April 1974, by a merger of the municipal borough of Newark with Newark Rural District and Southwell Rural District.

<span class="mw-page-title-main">Ashfield (UK Parliament constituency)</span> Parliamentary constituency in the United Kingdom, 1955 onwards

Ashfield is a constituency represented in the House of Commons of the UK Parliament by Lee Anderson of the Conservative Party. The constituency is in the English county of Nottinghamshire, East Midlands; located to the north west of the city of Nottingham in the Erewash Valley along the border with neighbouring county Derbyshire. Ashfield was part of the Red Wall which by and large, voted Conservative in the 2019 general election. In the 2016 referendum on membership of the European Union, Ashfield voted 70% in favour of Brexit.

<span class="mw-page-title-main">Newark (UK Parliament constituency)</span> Parliamentary constituency in the United Kingdom, 1885 onwards

Newark is a constituency in Nottinghamshire, England. It is currently represented by Robert Jenrick of the Conservative Party who won the seat in a by-election on 5 June 2014, following the resignation of Patrick Mercer in April 2014.

<span class="mw-page-title-main">Sherwood (UK Parliament constituency)</span> Parliamentary constituency in the United Kingdom, 1983 onwards

Sherwood is a constituency represented in the House of Commons of the UK Parliament since 2010 by Mark Spencer, a Conservative. The constituency takes its name from the Sherwood Forest which is in the area.

<span class="mw-page-title-main">Bassetlaw (UK Parliament constituency)</span> Parliamentary constituency in the United Kingdom, 1885 onwards

Bassetlaw is a parliamentary constituency in Nottinghamshire, represented in the House of Commons of the UK Parliament since the 2019 general election by Brendan Clarke-Smith, a Conservative. Before that election, the seat had been part of the so-called "red wall", being held by the Labour Party since 1929.

<span class="mw-page-title-main">Broxtowe (UK Parliament constituency)</span> Parliamentary constituency in the United Kingdom, 1983 onwards

Broxtowe is a parliamentary constituency in Nottinghamshire, England, represented in the House of Commons of the UK Parliament since 2019 by Darren Henry, a Conservative.

<span class="mw-page-title-main">Nottingham South (UK Parliament constituency)</span> Parliamentary constituency in the United Kingdom, 1983 onwards

Nottingham South is a constituency of the Parliament of the United Kingdom, represented since 2010 by Lilian Greenwood of the Labour Party.

<span class="mw-page-title-main">Mansfield (UK Parliament constituency)</span> Parliamentary constituency in the United Kingdom, 1885 onwards

Mansfield is a constituency created in 1885 represented in the House of Commons of the UK Parliament since 2017 by Ben Bradley of the Conservative Party, who gained the seat at the 2017 general election, from the Labour Party. This is the first time the seat has been represented by a Conservative since its creation in 1885.

<span class="mw-page-title-main">Stapleford, Nottinghamshire</span> Human settlement in England

Stapleford is a town and civil parish in the Borough of Broxtowe, Nottinghamshire, England, 5.6 miles (9.0 km) west of Nottingham. The population at the 2011 census was 15,241.

Broxtowe Borough Council elections are held every four years. Broxtowe Borough Council is the local authority for the non-metropolitan district of Borough of Broxtowe in Nottinghamshire, England. Since the full review of boundaries in 2015, 44 councillors are elected from 20 wards.

<span class="mw-page-title-main">Nottinghamshire County Council</span> The upper-tier local authority for the non-metropolitan county of Nottinghamshire in England

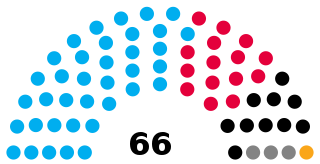
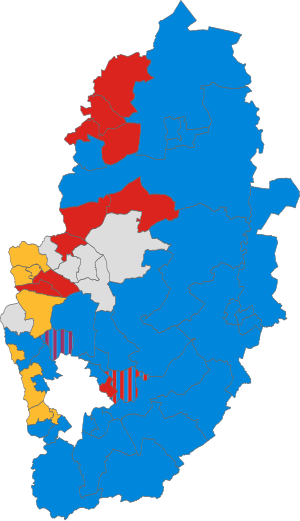
Nottinghamshire County Council is the upper-tier local authority for the non-metropolitan county of Nottinghamshire in England. It consists of 66 county councillors, elected from 56 electoral divisions every four years. The most recent election was held in 2021.

<span class="mw-page-title-main">Ben Bradley (politician)</span> English Conservative politician

Benjamin David Bradley is a British Conservative Party politician who has been the Member of Parliament (MP) for Mansfield, Nottinghamshire, since the 2017 general election.

Jason Bernard Zadrozny is a British local politician from the Ashfield Independents and Leader of Ashfield District Council.

<span class="mw-page-title-main">2011 Ashfield District Council election</span>

The 2011 Ashfield District Council election took place on 5 May 2011 to elect members of Ashfield District Council in Nottinghamshire, England. The whole council was up for election and the Labour party gained overall control of the council from no overall control.

<span class="mw-page-title-main">Mansfield Independents</span> Political party in the United Kingdom

Mansfield Independents, previously known as Mansfield Independent Forum, is a local political party in the local government district of Mansfield in Nottinghamshire, England. It was officially registered in 2005, having already successfully campaigned for the election of Tony Egginton as Mayor of Mansfield two years earlier. Egginton had stood for election after being convinced to do so by the leader of the pro-Mayoralty campaign, Stewart Rickersey.

<span class="mw-page-title-main">1989 Nottinghamshire County Council election</span>

The 1989 Nottinghamshire County Council election was held on Thursday, 4 May 1989. The whole council of eighty-eight members was up for election and the result was that the Labour Party retained control of the Council, winning fifty seats. The Conservatives won thirty-four councillors and the Social and Liberal Democrats won four seats.

References

  1. Nottinghamshire County Council, 2005 Election Results
  2. Battle for your vote starts in key marginals, Nottingham Evening Post , 2009-05-14
  3. The day before Notts' election, Nottingham Evening Post , 2009-06-03
  4. "Electoral Division results". Nottinghamshire County Council. Retrieved 6 November 2010.
  5. "Newark East by-election result". Nottinghamshire County Council. 18 September 2009. Retrieved 25 September 2009.
  6. 1 2 "Mansfield South by-election result". Nottinghamshire County Council. 26 February 2010. Retrieved 26 February 2010.