| |||||||||||||||||||||
All 39 seats to Newark and Sherwood District Council 20 seats needed for a majority | |||||||||||||||||||||
---|---|---|---|---|---|---|---|---|---|---|---|---|---|---|---|---|---|---|---|---|---|
| |||||||||||||||||||||
|
The 2019 Newark and Sherwood District Council election took place on 2 May 2019 to elect all 39 members of Newark and Sherwood District Council in Nottinghamshire, England. [1] This took place as part of the 2019 local elections.
The election resulted in the Conservative Party retaining its control of the council, with an increased majority. [2]
Party | Seats | Gains | Losses | Net gain/loss | Seats % | Votes % | Votes | +/− | |
---|---|---|---|---|---|---|---|---|---|
Conservative | 27 | 6 | 3 | 3 | 47.9 | 26,141 | |||
Labour | 7 | 1 | 6 | 5 | 26.9 | 14,651 | |||
Independent | 3 | 0 | 8.0 | 4,360 | |||||
Liberal Democrats | 2 | 2 | 2 | 12.8 | 6,986 | ||||
Party | Candidate | Votes | % | ±% | |
---|---|---|---|---|---|
Conservative | Johnno Lee | 900 | 51.9 | ||
Conservative | Betty Brooks | 866 | 49.9 | ||
Independent | Amanda Thompson | 351 | 20.2 | ||
UKIP | Michael Patchett | 324 | 18.7 | ||
Labour | Debbie Antcliffe | 289 | 16.7 | ||
Liberal Democrats | Anita Prabhakar | 204 | 11.8 | ||
Turnout | 1,747 | ||||
Conservative hold | |||||
Party | Candidate | Votes | % | ±% | |
---|---|---|---|---|---|
Conservative | Lydia Hurst | 640 | 67.9 | ||
Conservative | Ronnie White | 596 | 63.2 | ||
Labour | Maxine Leigh | 271 | 28.7 | ||
Labour | Jeremy Taylor | 262 | 27.8 | ||
Turnout | 997 | ||||
Conservative hold | |||||
Party | Candidate | Votes | % | ±% | |
---|---|---|---|---|---|
Conservative | Rita Crowe | 895 | 42.8 | ||
Conservative | David Lloyd | 879 | 42.0 | ||
Conservative | Mathew Skinner | 838 | 40.0 | ||
Green | Esther Cropper | 630 | 30.1 | ||
Labour | Naz Butt | 617 | 29.5 | ||
Labour | Peter Brookes | 532 | 25.4 | ||
Green | Jay Henderson | 496 | 23.7 | ||
Labour | Andrew Freeman | 466 | 22.3 | ||
Liberal Democrats | Jeffrey Thorpe | 317 | 15.1 | ||
Turnout | 2,137 | ||||
Conservative hold | |||||
Party | Candidate | Votes | % | ±% | |
---|---|---|---|---|---|
Conservative | Rhona Holloway | 526 | 62.0 | ||
Labour | Adam Murphy | 323 | 38.0 | ||
Turnout | 899 | ||||
Conservative gain from Labour |
Party | Candidate | Votes | % | ±% | |
---|---|---|---|---|---|
Conservative | Brendan Clarke-Smith | 414 | 52.4 | ||
Labour | Paula Hancock | 376 | 47.6 | ||
Turnout | 826 | ||||
Conservative gain from Labour |
Party | Candidate | Votes | % | ±% | |
---|---|---|---|---|---|
Independent | Gill Dawn | 671 | 57.4 | ||
Independent | Irene Brown | 647 | 55.3 | ||
Labour | Kevin Parnham | 300 | 25.6 | ||
Conservative | Roy Williams | 269 | 23.0 | ||
Conservative | Ian Harrison | 230 | 19.7 | ||
Turnout | 1,193 | ||||
Independent hold | |||||
Party | Candidate | Votes | % | ±% | |
---|---|---|---|---|---|
Conservative | Keith Girling | 323 | 42.6 | ||
Labour | James Baggaley | 230 | 30.3 | ||
Independent | Richard Belam | 125 | 16.5 | ||
Liberal Democrats | Chris Adams | 81 | 10.7 | ||
Turnout | 771 | ||||
Conservative hold | |||||
Party | Candidate | Votes | % | ±% | |
---|---|---|---|---|---|
Independent | Maureen Dobson | 1,419 | 78.3 | ||
Conservative | Linda Dales | 771 | 42.5 | ||
Liberal Democrats | Marylyn Rayner | 395 | 21.8 | ||
Turnout | 1,835 | ||||
Independent hold | |||||
Conservative hold | |||||
Party | Candidate | Votes | % | ±% | |
---|---|---|---|---|---|
Conservative | Max Cope | 686 | 38.3 | ||
Conservative | Bob Crowe | 672 | 37.5 | ||
Labour | Laurence Goff | 617 | 34.4 | ||
Labour | Dennis Jones | 547 | 30.5 | ||
Conservative | Simon Haynes | 545 | 30.4 | ||
Labour | Ruth Woodhall | 534 | 29.8 | ||
Independent | Tracy Mathias | 468 | 26.1 | ||
Green | Lucy Pegler | 434 | 24.2 | ||
Turnout | 1,822 | ||||
Conservative hold | |||||
Labour gain from Conservative |
Party | Candidate | Votes | % | ±% | |
---|---|---|---|---|---|
Conservative | Roger Jackson | 716 | 76.8 | ||
Labour | Craig Pitchford | 216 | 23.2 | ||
Turnout | 972 | ||||
Conservative hold | Swing | ||||
Party | Candidate | Votes | % | ±% | |
---|---|---|---|---|---|
Conservative | Scott Carlton | 989 | 45.1 | ||
Labour | Paul Peacock | 983 | 44.9 | ||
Conservative | Michael Brown | 969 | 44.2 | ||
Conservative | Gina Aldridge | 949 | 43.3 | ||
Labour | Anne Brooks | 946 | 43.2 | ||
Labour | Karl Beresford | 931 | 42.5 | ||
Turnout | 2,281 | ||||
Conservative gain from Labour | |||||
Labour hold | |||||
Conservative gain from Labour |
Party | Candidate | Votes | % | ±% | |
---|---|---|---|---|---|
Conservative | Ivor Walker | 879 | 54.1 | ||
Conservative | Keith Walker | 805 | 49.5 | ||
Conservative | Neill Mison | 780 | 48.0 | ||
Liberal Democrats | Moira Walter | 506 | 31.1 | ||
Liberal Democrats | Heather Cullen | 443 | 27.2 | ||
Liberal Democrats | Ryan Cullen | 381 | 23.4 | ||
Labour | Roger Gannaway | 313 | 19.2 | ||
Turnout | 1,681 | ||||
Conservative hold | |||||
Party | Candidate | Votes | % | ±% | |
---|---|---|---|---|---|
Conservative | Robert Laughton | 528 | 54.3 | ||
Liberal Democrats | Jackie Johnson | 260 | 26.7 | ||
Labour | John Pearson | 184 | 18.9 | ||
Turnout | 991 | ||||
Conservative hold | |||||
Party | Candidate | Votes | % | ±% | |
---|---|---|---|---|---|
Conservative | Timothy Wendels | 545 | 57.7 | ||
Green | Thomas Platt | 177 | 18.7 | ||
Liberal Democrats | Peter Scorer | 112 | 11.9 | ||
Labour | Christine Gibbon | 111 | 11.7 | ||
Turnout | 956 | ||||
Conservative hold | |||||
Party | Candidate | Votes | % | ±% | |
---|---|---|---|---|---|
Conservative | Sue Saddington | 707 | 72.3 | ||
Liberal Democrats | Vivian Scorer | 154 | 15.7 | ||
Labour | Darrell Pointing | 117 | 12.0 | ||
Turnout | 1,003 | ||||
Conservative hold | |||||
Party | Candidate | Votes | % | ±% | |
---|---|---|---|---|---|
Labour | Lee Brazier | 1,133 | 59.3 | ||
Labour | Donna Cumberlidge | 1,043 | 54.6 | ||
Labour | Neal Mitchell | 945 | 49.5 | ||
Conservative | Hannah Smith | 628 | 32.9 | ||
Conservative | Philip Jones | 606 | 31.7 | ||
Conservative | Fraser McFarland | 578 | 30.2 | ||
Turnout | 2,040 | ||||
Labour hold | |||||
Labour hold | |||||
Labour hold | |||||
Party | Candidate | Votes | % | ±% | |
---|---|---|---|---|---|
Conservative | Tom Smith | 770 | 56.0 | ||
Conservative | Dr Louis Brailsford | 740 | 53.9 | ||
Labour | Linda Tift | 567 | 41.3 | ||
Labour | Andy Szpuk | 453 | 33.0 | ||
Turnout | 1,450 | ||||
Conservative gain from Labour | |||||
Conservative gain from Labour |
Party | Candidate | Votes | % | ±% | |
---|---|---|---|---|---|
Labour | Yvonne Woodhead | 450 | 39.0 | ||
Labour | Kathleen Arnold | 401 | 34.8 | ||
Independent | John Cheesmond | 345 | 29.9 | ||
Conservative | Mark Wheatley | 341 | 29.6 | ||
Independent | Martin Atherton | 334 | 29.0 | ||
Conservative | Steve Jackson | 292 | 25.3 | ||
Turnout | 1,169 | ||||
Labour hold | |||||
Labour hold | |||||
Party | Candidate | Votes | % | ±% | |
---|---|---|---|---|---|
Liberal Democrats | Peter Harris | 1,408 | 46.2 | ||
Conservative | Penny Rainbow | 1,384 | 45.4 | ||
Liberal Democrats | Malcolm Brock | 1,208 | 39.6 | ||
Liberal Democrats | Stuart Thompstone | 1,198 | 39.3 | ||
Conservative | Geoffrey Handley | 1,186 | 38.9 | ||
Conservative | Peter Brooker | 1,153 | 37.8 | ||
Labour | James Dixon | 407 | 13.3 | ||
UKIP | Christopher Brown | 267 | 8.8 | ||
Turnout | 3,089 | ||||
Liberal Democrats gain from Conservative | |||||
Conservative hold | |||||
Liberal Democrats gain from Conservative |
Party | Candidate | Votes | % | ±% | |
---|---|---|---|---|---|
Conservative | Sylvia Mitchell | Unopposed | |||
Majority | |||||
Turnout | |||||
Conservative hold | Swing | ||||
Party | Candidate | Votes | % | ±% | |
---|---|---|---|---|---|
Conservative | Roger Blaney | 573 | 53.3 | ||
Liberal Democrats | Keith Melton | 319 | 29.7 | ||
UKIP | Robert Hall-Palmer | 96 | 8.9 | ||
Labour | Jennie Mann | 87 | 8.1 | ||
Turnout | 1,084 | ||||
Conservative hold | |||||
Party | Candidate | Votes | % | ±% | |
---|---|---|---|---|---|
Independent | Tina Thompson | 650 | 66.2 | N/A | |
Conservative | Sheila Jackson | 168 | 17.1 | -12.9 | |
Labour | Callum Walsh | 164 | 16.7 | -22.9 | |
Majority | 482 | 49.1 | |||
Turnout | 982 | 22.2 | |||
Independent gain from Labour | Swing | 26.7 | |||
Party | Candidate | Votes | % | ±% | |
---|---|---|---|---|---|
Conservative | Emma Davis | 982 | 56.3 | +26.5 | |
Liberal Democrats | Phil Barron | 594 | 34.1 | +18.8 | |
Labour | Matthew Spoors | 168 | 9.6 | N/A | |
Majority | 388 | 22.2 | |||
Turnout | 1,744 | 37.8 | |||
Conservative gain from Independent | Swing | 3.9 | |||
Nottinghamshire is a ceremonial county in the East Midlands of England. The county borders South Yorkshire to the north-west, Lincolnshire to the east, Leicestershire to the south, and Derbyshire to the west. The largest settlement is the city of Nottingham (323,632).
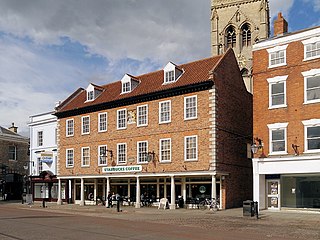
Newark-on-Trent or Newark is a market town and civil parish in the Newark and Sherwood district in Nottinghamshire, England. It is on the River Trent, and was historically a major inland port. The A1 road bypasses the town on the line of the ancient Great North Road. The town's origins are likely to be Roman, as it lies on a major Roman road, the Fosse Way. It grew up round Newark Castle, St Mary Magdalene church and later developed as a centre for the wool and cloth trades.
West Lindsey is a local government district in Lincolnshire, England. Its council is based in Gainsborough, the district's largest town. The district also includes the towns of Caistor and Market Rasen, along with numerous villages and surrounding rural areas. The east of the district includes part of the Lincolnshire Wolds, a designated Area of Outstanding Natural Beauty.
Ashfield is a local government district in Nottinghamshire, England. The council is based in Kirkby-in-Ashfield, but the largest town is neighbouring Sutton-in-Ashfield. The district also contains the town of Hucknall and a few villages. The district is mostly urban, with some of its settlements forming parts of both the Nottingham and Mansfield Urban Areas.
Newark and Sherwood is a local government district in Nottinghamshire, England. It is the largest district by area in the county. The council is based in Newark-on-Trent, the area's largest town. The district also includes the towns of Southwell and Ollerton along with a large rural area containing many villages. Much of the district lies within the ancient Sherwood Forest and there are also extensive forestry plantations in the area.
Rushcliffe is a local government district with borough status in south Nottinghamshire, England. Its council is based in West Bridgford. The borough also includes the towns of Bingham and Cotgrave as well as numerous villages and surrounding rural areas. Some of the built-up areas in the north-west of the borough, including West Bridgford, form part of the Nottingham Urban Area.
Gedling is a local government district with borough status in Nottinghamshire, England. The council is based in Arnold. The borough also includes Carlton along with villages and rural areas to the north-east of Nottingham. The main built-up part of the borough around Arnold and Carlton forms part of the Nottingham Urban Area.
Newark is a constituency in Nottinghamshire, England. It is currently represented by Robert Jenrick of the Conservative Party who won the seat in a by-election on 5 June 2014, following the resignation of Patrick Mercer in April 2014.
Sherwood is a constituency represented in the House of Commons of the UK Parliament since 2010 by Mark Spencer, a Conservative. The constituency's name is common with Sherwood Forest which is in the area.
Mansfield is a constituency created in 1885 represented in the House of Commons of the UK Parliament since 2017 by Ben Bradley of the Conservative Party, who gained the seat at the 2017 general election, from the Labour Party. This is the first time the seat has been represented by a Conservative since its creation in 1885.
Southwell is a minster and market town, and a civil parish, in the district of Newark and Sherwood in Nottinghamshire, England. It is home to the grade-I listed Southwell Minster, the cathedral of the Anglican Diocese of Southwell and Nottingham. The population of the town was recorded at 7,491 in the 2021 census.
Newark and Sherwood District Council elections are held every four years. Newark and Sherwood District Council is the local authority for the non-metropolitan district of Newark and Sherwood in Nottinghamshire, England. Since the last boundary changes in 2015, 39 councillors have been elected from 21 wards.
Rainworth is a village in the ceremonial county of Nottinghamshire in the East Midlands of England. It is split between the local government districts of Newark and Sherwood and Mansfield.
Nottinghamshire County Council is the upper-tier local authority for the non-metropolitan county of Nottinghamshire in England. It consists of 66 county councillors, elected from 56 electoral divisions every four years. The most recent election was held in 2021.
Elections to Nottinghamshire County Council took place on 4 June 2009, having been delayed from 7 May, in order to coincide with elections to the European Parliament.
The 2011 Newark and Sherwood District Council election took place on 5 May 2011 to elect members of Sherwood & Newark District Council in Nottinghamshire, England. The whole council was up for election. At the time of the 2011 Census the Local Authority had a population of, 114,817.
On 5 June 2014, a by-election was held for the UK parliamentary constituency of Newark, following the resignation of Patrick Mercer. Conservative Robert Jenrick won the seat with a majority of 7,403.
The 2015 Newark and Sherwood District Council election took place on 7 May 2015 to elect members of the Newark and Sherwood District Council in England. It was held on the same day as other local elections.
Nottingham City Council elections are held every four years. Nottingham City Council is the local authority for the unitary authority of Nottingham in Nottinghamshire, England. Until 1 April 1998 it was a non-metropolitan district. Since the last boundary changes in 2019, 55 councillors are elected from 20 wards.
The 2023 Newark and Sherwood District Council election took place on 4 May 2023, to elect all 39 members of Newark and Sherwood District Council in Nottinghamshire, England.